Chrysler 2010 Annual Report Download - page 352
Download and view the complete annual report
Please find page 352 of the 2010 Chrysler annual report below. You can navigate through the pages in the report by either clicking on the pages listed below, or by using the keyword search tool below to find specific information within the annual report.-
 1
1 -
2
-
3
-
4
-
5
-
6
-
7
-
8
-
9
-
10
-
11
-
12
-
13
-
14
-
15
-
16
-
17
-
18
-
19
-
20
-
21
-
22
-
23
-
24
-
25
-
26
-
27
-
28
-
29
-
30
-
31
-
32
-
33
-
34
-
35
-
36
-
37
-
38
-
39
-
40
-
41
-
42
-
43
-
44
-
45
-
46
-
47
-
48
-
49
-
50
-
51
-
52
-
53
-
54
-
55
-
56
-
57
-
58
-
59
-
60
-
61
-
62
-
63
-
64
-
65
-
66
-
67
-
68
-
69
-
70
-
71
-
72
-
73
-
74
-
75
-
76
-
77
-
78
-
79
-
80
-
81
-
82
-
83
-
84
-
85
-
86
-
87
-
88
-
89
-
90
-
91
-
92
-
93
-
94
-
95
-
96
-
97
-
98
-
99
-
100
-
101
-
102
-
103
-
104
-
105
-
106
-
107
-
108
-
109
-
110
-
111
-
112
-
113
-
114
-
115
-
116
-
117
-
118
-
119
-
120
-
121
-
122
-
123
-
124
-
125
-
126
-
127
-
128
-
129
-
130
-
131
-
132
-
133
-
134
-
135
-
136
-
137
-
138
-
139
-
140
-
141
-
142
-
143
-
144
-
145
-
146
-
147
-
148
-
149
-
150
-
151
-
152
-
153
-
154
-
155
-
156
-
157
-
158
-
159
-
160
-
161
-
162
-
163
-
164
-
165
-
166
-
167
-
168
-
169
-
170
-
171
-
172
-
173
-
174
-
175
-
176
-
177
-
178
-
179
-
180
-
181
-
182
-
183
-
184
-
185
-
186
-
187
-
188
-
189
-
190
-
191
-
192
-
193
-
194
-
195
-
196
-
197
-
198
-
199
-
200
-
201
-
202
-
203
-
204
-
205
-
206
-
207
-
208
-
209
-
210
-
211
-
212
-
213
-
214
-
215
-
216
-
217
-
218
-
219
-
220
-
221
-
222
-
223
-
224
-
225
-
226
-
227
-
228
-
229
-
230
-
231
-
232
-
233
-
234
-
235
-
236
-
237
-
238
-
239
-
240
-
241
-
242
-
243
-
244
-
245
-
246
-
247
-
248
-
249
-
250
-
251
-
252
-
253
-
254
-
255
-
256
-
257
-
258
-
259
-
260
-
261
-
262
-
263
-
264
-
265
-
266
-
267
-
268
-
269
-
270
-
271
-
272
-
273
-
274
-
275
-
276
-
277
-
278
-
279
-
280
-
281
-
282
-
283
-
284
-
285
-
286
-
287
-
288
-
289
-
290
-
291
-
292
-
293
-
294
-
295
-
296
-
297
-
298
-
299
-
300
-
301
-
302
-
303
-
304
-
305
-
306
-
307
-
308
-
309
-
310
-
311
-
312
-
313
-
314
-
315
-
316
-
317
-
318
-
319
-
320
-
321
-
322
-
323
-
324
-
325
-
326
-
327
-
328
-
329
-
330
-
331
-
332
-
333
-
334
-
335
-
336
-
337
-
338
-
339
-
340
-
341
-
 342
342 -
 343
343 -
 344
344 -
 345
345 -
 346
346 -
 347
347 -
 348
348 -
 349
349 -
 350
350 -
 351
351 -
 352
352 -
 353
353 -
 354
354 -
 355
355 -
 356
356 -
 357
357 -
 358
358 -
 359
359 -
 360
360 -
 361
361 -
 362
362 -
363
-
364
-
365
-
366
-
367
-
368
-
369
-
370
-
371
-
372
-
373
-
374
-
375
-
376
-
377
-
378
-
379
-
380
-
381
-
382
-
383
-
384
-
385
-
386
-
387
-
388
-
389
-
390
-
391
-
392
-
393
-
394
-
395
-
396
-
397
-
398
-
399
-
400
-
401
-
402
 |
 |

351
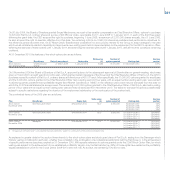
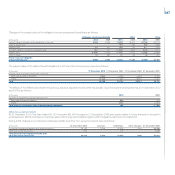
26. Other payables
At 31 December 2010, other payables amounted to €368,408 thousand, a net increase of €78,350 thousand over 31 December 2009, and included the
following:
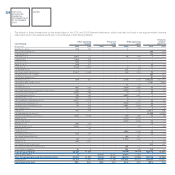
(€ thousand) 31 December 2010 31 December 2009 Change
Advances 2,009 5,865 (3,856)
Other payables:
Intercompany payables:
Consolidated VAT 131,408 124,348 7,060
Consolidated IRES tax 211,576 133,806 77,770
Other intercompany payables 104 - 104
Total intercompany payables 343,088 258,154 84,934
Social security payables 1,837 1,803 34
Current amounts payable to employees, directors and statutory auditors 13,038 5,629 7,409
Payables to shareholders of Toro Assicurazioni S.p.A., Magneti Marelli S.p.A.
and Comau S.p.A. for public offerings 642 860 (218)
Dividends payable 330 290 40
Other 295 1,871 (1,576)
Total other payables 359,230 268,607 90,623
Tax payables:
VAT payable 2,388 13,034 (10,646)
Taxes withheld on payments to employees and independent contractors 4,245 2,022 2,223
Other 432 433 (1)
Total tax payables 7,065 15,489 (8,424)
Accrued expenses and deferred income 104 97 7
Total other payables 368,408 290,058 78,350
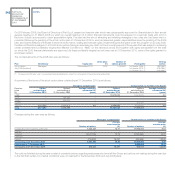
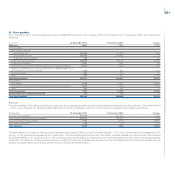
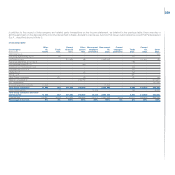
Advances
This item consists of the difference between inventories and progress payments and contractual advances received from the customer Treno Alta Velocità
– T.A.V. S.p.A. (merged into Rete Ferroviaria Italiana S.p.A. as of 31 December 2010) for contract work in progress and is made up as follows:
(€ thousand) 31 December 2010 31 December 2009 Change
Contract work in progress 242,709 237,254 5,455
Less: Progress payments for work completed 244,479 242,370 2,109
Gross amount due to the customer 1,770 5,116 (3,346)
Net contractual advances 239 749 (510)
Total advances 2,009 5,865 (3,856)
The item relates to contracts for the high speed railway project between Fiat S.p.A. and Treno Alta Velocità – T.A.V. S.p.A. (which was in turn engaged by F.S.
S.p.A.), for the operational engineering and construction of two lines (Bologna-Florence and Turin-Milan, the latter divided into two sub-lines: Turin-Novara
and Novara-Milan). At 31 December 2010, the contractual amounts (including for additional work, monetary adjustments and other contractual amounts)
totaled €5,190 million for the Bologna-Florence line and €2,278 million for the Milan-Novara sub-line. The contractual amount for the Turin-Novara sub-line
(project completed and accounting closed at the end of 2009) was €4,669 million.