Chrysler 2010 Annual Report Download - page 247
Download and view the complete annual report
Please find page 247 of the 2010 Chrysler annual report below. You can navigate through the pages in the report by either clicking on the pages listed below, or by using the keyword search tool below to find specific information within the annual report.-
 1
1 -
2
-
3
-
4
-
5
-
6
-
7
-
8
-
9
-
10
-
11
-
12
-
13
-
14
-
15
-
16
-
17
-
18
-
19
-
20
-
21
-
22
-
23
-
24
-
25
-
26
-
27
-
28
-
29
-
30
-
31
-
32
-
33
-
34
-
35
-
36
-
37
-
38
-
39
-
40
-
41
-
42
-
43
-
44
-
45
-
46
-
47
-
48
-
49
-
50
-
51
-
52
-
53
-
54
-
55
-
56
-
57
-
58
-
59
-
60
-
61
-
62
-
63
-
64
-
65
-
66
-
67
-
68
-
69
-
70
-
71
-
72
-
73
-
74
-
75
-
76
-
77
-
78
-
79
-
80
-
81
-
82
-
83
-
84
-
85
-
86
-
87
-
88
-
89
-
90
-
91
-
92
-
93
-
94
-
95
-
96
-
97
-
98
-
99
-
100
-
101
-
102
-
103
-
104
-
105
-
106
-
107
-
108
-
109
-
110
-
111
-
112
-
113
-
114
-
115
-
116
-
117
-
118
-
119
-
120
-
121
-
122
-
123
-
124
-
125
-
126
-
127
-
128
-
129
-
130
-
131
-
132
-
133
-
134
-
135
-
136
-
137
-
138
-
139
-
140
-
141
-
142
-
143
-
144
-
145
-
146
-
147
-
148
-
149
-
150
-
151
-
152
-
153
-
154
-
155
-
156
-
157
-
158
-
159
-
160
-
161
-
162
-
163
-
164
-
165
-
166
-
167
-
168
-
169
-
170
-
171
-
172
-
173
-
174
-
175
-
176
-
177
-
178
-
179
-
180
-
181
-
182
-
183
-
184
-
185
-
186
-
187
-
188
-
189
-
190
-
191
-
192
-
193
-
194
-
195
-
196
-
197
-
198
-
199
-
200
-
201
-
202
-
203
-
204
-
205
-
206
-
207
-
208
-
209
-
210
-
211
-
212
-
213
-
214
-
215
-
216
-
217
-
218
-
219
-
220
-
221
-
222
-
223
-
224
-
225
-
226
-
227
-
228
-
229
-
230
-
231
-
232
-
233
-
234
-
235
-
236
-
 237
237 -
 238
238 -
 239
239 -
 240
240 -
 241
241 -
 242
242 -
 243
243 -
 244
244 -
 245
245 -
 246
246 -
 247
247 -
 248
248 -
 249
249 -
 250
250 -
 251
251 -
 252
252 -
 253
253 -
 254
254 -
 255
255 -
 256
256 -
 257
257 -
258
-
259
-
260
-
261
-
262
-
263
-
264
-
265
-
266
-
267
-
268
-
269
-
270
-
271
-
272
-
273
-
274
-
275
-
276
-
277
-
278
-
279
-
280
-
281
-
282
-
283
-
284
-
285
-
286
-
287
-
288
-
289
-
290
-
291
-
292
-
293
-
294
-
295
-
296
-
297
-
298
-
299
-
300
-
301
-
302
-
303
-
304
-
305
-
306
-
307
-
308
-
309
-
310
-
311
-
312
-
313
-
314
-
315
-
316
-
317
-
318
-
319
-
320
-
321
-
322
-
323
-
324
-
325
-
326
-
327
-
328
-
329
-
330
-
331
-
332
-
333
-
334
-
335
-
336
-
337
-
338
-
339
-
340
-
341
-
342
-
343
-
344
-
345
-
346
-
347
-
348
-
349
-
350
-
351
-
352
-
353
-
354
-
355
-
356
-
357
-
358
-
359
-
360
-
361
-
362
-
363
-
364
-
365
-
366
-
367
-
368
-
369
-
370
-
371
-
372
-
373
-
374
-
375
-
376
-
377
-
378
-
379
-
380
-
381
-
382
-
383
-
384
-
385
-
386
-
387
-
388
-
389
-
390
-
391
-
392
-
393
-
394
-
395
-
396
-
397
-
398
-
399
-
400
-
401
-
402
 |
 |

FIAT GROUP
CONSOLIDATED
FINANCIAL
STATEMENTS
AT 31 DECEMBER
2010
NOTES
246
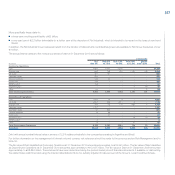
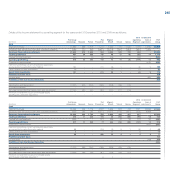
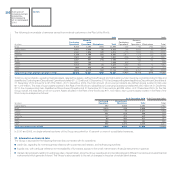
Details of the income statement by operating segment for Discontinued Operations for the years ended 31 December 2010 and 2009, based on the rules
used for operating segments forming part of Continuing Operations, are as follows:
2010 2009
Other Unallocated Other Unallocated
FPT Operating items & FPT Operating items &
(€ million) CNH Iveco Industrial Segments adjustments Total CNH Iveco Industrial Segments adjustments Total
Segment revenues 11,906 8,307 2,415 394 (1,680)
21,342 10,107 7,183 1,580 211 (1,113) 17,968
Revenues from transactions with other
operating segments (12) (107) (1,561) - 1,680 - (22) (78) (1,034) 21 1,113 -
Revenues from external customers 11,894 8,200 854 394 - 21,342 10,085 7,105 546 232 - 17,968
Trading profit/(loss) 755 270 65 (2) 4 1,092 337 105 (131) 8 3 322
Unusual income/(expense) (1) (30) (36) (6) (2) (75) (86) (195) (60) - - (341)
Operating profit/(loss) 754 240 29 (8) 2 1,017 251 (90) (191) 8 3 (19)
Financial income/(expense) (505) (505) (401) (401)
Interest in profit/(loss) of joint ventures
and associates accounted for by the equity method 75 (5) - - - 70 (26) (21) - - - (47)
Other profit/(loss) from investments - (6) - - - (6) - (3) - - - (3)
Result from investments 75 (11) - - - 64 (26) (24) - - - (50)
Profit/(loss) before taxes 576 (470)
Income taxes 198 198 33 33
Profit/(loss) from Discontinued Operations 378 (503)
Amortisation and depreciation (365) (382) (147) (325) (380) (157)
Goodwill impairment - - - - - -
Non-cash items other than depreciation
and amortisation (2,466) (676) (99) (2,279) (618) (65)
Reversal of impairment losses on Intangible assets
and Property, plant and equipment - - - - - -
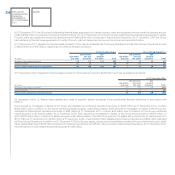
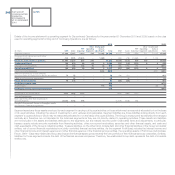
Segment assets are those assets employed by each segment in carrying out its usual activities or those which may be reasonably allocated to it on the basis
of its usual activities, including the value of investments in joint ventures and associates. Segment liabilities are those liabilities arising directly from each
segment’s usual activities or which may be reasonably allocated to it on the basis of its usual activities. The Group’s treasury and tax activities are managed
centrally and, therefore, are not allocated to the individual segments as they are not directly related to operating activities. These assets and liabilities
are not included in the assets and liabilities attributed to the segments, but are instead reported under Unallocated items and adjustments. In particular,
treasury assets include amounts receivable from financing activities, other non-current receivables, securities and other financial assets, and cash and
cash equivalents of the Group’s industrial entities. Treasury liabilities, on the other hand, include debt and other financial liabilities of the Group’s industrial
entities, net of current financial receivables from jointly-controlled financial services entities. As the segment Profit/(loss) includes the Interest income and
other financial income and Interest expense and other financial expense of the financial services entities, the operating assets of Fiat Group Automobiles,
Ferrari, CNH – Case New Holland and Iveco also include the financial assets (predominantly the loan portfolio) of their financial services companies. Similarly,
liabilities for those segments include the debt of the financial services companies. Therefore, the unallocated Group debt represents the debt of industrial
entities only.