Chrysler 2010 Annual Report Download - page 66
Download and view the complete annual report
Please find page 66 of the 2010 Chrysler annual report below. You can navigate through the pages in the report by either clicking on the pages listed below, or by using the keyword search tool below to find specific information within the annual report.-
 1
1 -
 2
2 -
 3
3 -
 4
4 -
 5
5 -
 6
6 -
 7
7 -
 8
8 -
 9
9 -
 10
10 -
 11
11 -
 12
12 -
 13
13 -
 14
14 -
 15
15 -
 16
16 -
 17
17 -
 18
18 -
 19
19 -
 20
20 -
 21
21 -
 22
22 -
 23
23 -
 24
24 -
 25
25 -
 26
26 -
 27
27 -
 28
28 -
 29
29 -
 30
30 -
 31
31 -
 32
32 -
 33
33 -
 34
34 -
 35
35 -
 36
36 -
 37
37 -
 38
38 -
 39
39 -
 40
40 -
 41
41 -
 42
42 -
 43
43 -
 44
44 -
 45
45 -
 46
46 -
 47
47 -
 48
48 -
 49
49 -
 50
50 -
 51
51 -
 52
52 -
 53
53 -
 54
54 -
 55
55 -
 56
56 -
 57
57 -
 58
58 -
 59
59 -
 60
60 -
 61
61 -
 62
62 -
 63
63 -
 64
64 -
 65
65 -
 66
66 -
 67
67 -
 68
68 -
 69
69 -
 70
70 -
 71
71 -
 72
72 -
 73
73 -
 74
74 -
 75
75 -
 76
76 -
 77
77 -
 78
78 -
 79
79 -
 80
80 -
 81
81 -
 82
82 -
 83
83 -
 84
84 -
 85
85 -
 86
86 -
 87
87 -
 88
88 -
 89
89 -
 90
90 -
 91
91 -
 92
92 -
 93
93 -
 94
94 -
 95
95 -
 96
96 -
 97
97 -
 98
98 -
 99
99 -
 100
100 -
 101
101 -
 102
102 -
 103
103 -
 104
104 -
 105
105 -
 106
106 -
 107
107 -
 108
108 -
 109
109 -
 110
110 -
 111
111 -
 112
112 -
 113
113 -
 114
114 -
 115
115 -
 116
116 -
 117
117 -
 118
118 -
 119
119 -
 120
120 -
 121
121 -
 122
122 -
 123
123 -
 124
124 -
 125
125 -
 126
126 -
 127
127 -
 128
128 -
 129
129 -
 130
130 -
 131
131 -
 132
132 -
 133
133 -
 134
134 -
 135
135 -
 136
136 -
 137
137 -
 138
138 -
 139
139 -
 140
140 -
 141
141 -
 142
142 -
 143
143 -
 144
144 -
 145
145 -
 146
146 -
 147
147 -
 148
148 -
 149
149 -
 150
150 -
 151
151 -
 152
152 -
 153
153 -
 154
154 -
 155
155 -
 156
156 -
 157
157 -
 158
158 -
 159
159 -
 160
160 -
 161
161 -
 162
162 -
 163
163 -
 164
164 -
 165
165 -
 166
166 -
 167
167 -
 168
168 -
 169
169 -
 170
170 -
 171
171 -
 172
172 -
 173
173 -
 174
174 -
 175
175 -
 176
176 -
 177
177 -
 178
178 -
 179
179 -
 180
180 -
 181
181 -
 182
182 -
 183
183 -
 184
184 -
 185
185 -
 186
186 -
 187
187 -
 188
188 -
 189
189 -
 190
190 -
 191
191 -
 192
192 -
 193
193 -
 194
194 -
 195
195 -
 196
196 -
 197
197 -
 198
198 -
 199
199 -
 200
200 -
 201
201 -
 202
202 -
 203
203 -
 204
204 -
 205
205 -
 206
206 -
 207
207 -
 208
208 -
 209
209 -
 210
210 -
 211
211 -
 212
212 -
 213
213 -
 214
214 -
 215
215 -
 216
216 -
 217
217 -
 218
218 -
 219
219 -
 220
220 -
 221
221 -
 222
222 -
 223
223 -
 224
224 -
 225
225 -
 226
226 -
 227
227 -
 228
228 -
 229
229 -
 230
230 -
 231
231 -
 232
232 -
 233
233 -
 234
234 -
 235
235 -
 236
236 -
 237
237 -
 238
238 -
 239
239 -
 240
240 -
 241
241 -
 242
242 -
 243
243 -
 244
244 -
 245
245 -
 246
246 -
 247
247 -
 248
248 -
 249
249 -
 250
250 -
 251
251 -
 252
252 -
 253
253 -
 254
254 -
 255
255 -
 256
256 -
 257
257 -
 258
258 -
 259
259 -
 260
260 -
 261
261 -
 262
262 -
 263
263 -
 264
264 -
 265
265 -
 266
266 -
 267
267 -
 268
268 -
 269
269 -
 270
270 -
 271
271 -
 272
272 -
 273
273 -
 274
274 -
 275
275 -
 276
276 -
 277
277 -
 278
278 -
 279
279 -
 280
280 -
 281
281 -
 282
282 -
 283
283 -
 284
284 -
 285
285 -
 286
286 -
 287
287 -
 288
288 -
 289
289 -
 290
290 -
 291
291 -
 292
292 -
 293
293 -
 294
294 -
 295
295 -
 296
296 -
 297
297 -
 298
298 -
 299
299 -
 300
300 -
 301
301 -
 302
302 -
 303
303 -
 304
304 -
 305
305 -
 306
306 -
 307
307 -
 308
308 -
 309
309 -
 310
310 -
 311
311 -
 312
312 -
 313
313 -
 314
314 -
 315
315 -
 316
316 -
 317
317 -
 318
318 -
 319
319 -
 320
320 -
 321
321 -
 322
322 -
 323
323 -
 324
324 -
 325
325 -
 326
326 -
 327
327 -
 328
328 -
 329
329 -
 330
330 -
 331
331 -
 332
332 -
 333
333 -
 334
334 -
 335
335 -
 336
336 -
 337
337 -
 338
338 -
 339
339 -
 340
340 -
 341
341 -
 342
342 -
 343
343 -
 344
344 -
 345
345 -
 346
346 -
 347
347 -
 348
348 -
 349
349 -
 350
350 -
 351
351 -
 352
352 -
 353
353 -
 354
354 -
 355
355 -
 356
356 -
 357
357 -
 358
358 -
 359
359 -
 360
360 -
 361
361 -
 362
362 -
 363
363 -
 364
364 -
 365
365 -
 366
366 -
 367
367 -
 368
368 -
 369
369 -
 370
370 -
 371
371 -
 372
372 -
 373
373 -
 374
374 -
 375
375 -
 376
376 -
 377
377 -
 378
378 -
 379
379 -
 380
380 -
 381
381 -
 382
382 -
 383
383 -
 384
384 -
 385
385 -
 386
386 -
 387
387 -
 388
388 -
 389
389 -
 390
390 -
 391
391 -
 392
392 -
 393
393 -
 394
394 -
 395
395 -
 396
396 -
 397
397 -
 398
398 -
 399
399 -
 400
400 -
 401
401 -
 402
402
 |
 |

65
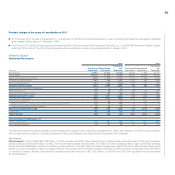
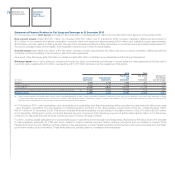
Principal changes in the scope of consolidation in 2010
On 1 February 2010, the sale of Targa Rent S.r.l., a subsidiary of the Fiat Group Automobiles sector, was completed; this investment was already classified
under assets held for sale at 31 December 2009.
On 30 June 2010, the Fiat Group acquired the remaining 50% of the joint venture Fiat Powertrain Polska Sp. z.o.o. (ex Fiat-GM Powertrain Polska), thereby
obtaining 100% control. The 50% interest acquired was consolidated on a line-by-line basis effective 1 January 2010.
FINANCIAL REVIEW
Operating Performance
2010 2009
Fiat Group Fiat Group
Continuing Discontinued pre Continuing Discontinued pre
(€ million) Operations Operations Demerger Operations Operations Demerger
Net revenues 35,880 21,342 56,258 32,684 17,968 50,102
Cost of sales 30,718 17,979 47,738 28,252 15,549 43,261
Selling, general and administrative 2,956 1,793 4,742 2,673 1,636 4,296
Research and development 1,013 418 1,431 1,010 388 1,398
Other income/(expense) (81) (60) (143) (13) (73) (89)
TRADING PROFIT/(LOSS) 1,112 1,092 2,204 736 322 1,058
Gains/(losses) on disposal of investments 12 3 15 3 1 4
Restructuring costs 118 58 176 168 144 312
Other unusual income/(expense) (14) (20) (34) (193) (198) (391)
OPERATING PROFIT/(LOSS) 992 1,017 2,009 378 (19) 359
Financial income/(expense) (400) (505) (905) (352) (401) (753)
Result from investments: 114 64 178 77 (50) 27
Share of profit/(loss) of investees accounted for using the equity method 120 70 190 65 (47) 18
Other income/(expense) from investments (6) (6) (12) 12 (3) 9
PROFIT/(LOSS) BEFORE TAXES 706 576 1,282 103 (470) (367)
Income taxes 484 198 682 448 33 481
PROFIT/(LOSS) 222 378 600 (345) (503) (848)
PROFIT/(LOSS) ATTRIBUTABLE TO:
Owners of the parent 179 341 520 (374) (464) (838)
Non-controlling interests 43 37 80 29 (39) (10)
The following review provides an analysis of net revenues and trading profit by individual business/sector. Other data relates to the Fiat Group as a whole,
with a breakdown provided for Continuing Operations (Fiat post Demerger) and Discontinued Operations (Fiat Industrial).
Net revenues
Net revenues for 2010 totaled €56,258 million, a 12.3% increase over 2009, when overall trading conditions were particularly weak. Continuing Operations
posted revenues of €35,880 million (+9.8%). The Automobiles business recorded €30,130 million (+6.3%): increased sales of light commercial vehicles,
and by Ferrari and Maserati, in addition to positive currency effects, more than offset the decline in passenger cars for Fiat Group Automobiles, following the
phase-out of eco-incentives in major European markets. Components and Production Systems achieved a 23.6% increase in revenues to €10,865 million
on the back of higher demand. Discontinued Operations recorded revenues of €21,342 million, up 18.8% over 2009, with significant volume recoveries
for all businesses.
