Chrysler 2010 Annual Report Download - page 197
Download and view the complete annual report
Please find page 197 of the 2010 Chrysler annual report below. You can navigate through the pages in the report by either clicking on the pages listed below, or by using the keyword search tool below to find specific information within the annual report.-
 1
1 -
2
-
3
-
4
-
5
-
6
-
7
-
8
-
9
-
10
-
11
-
12
-
13
-
14
-
15
-
16
-
17
-
18
-
19
-
20
-
21
-
22
-
23
-
24
-
25
-
26
-
27
-
28
-
29
-
30
-
31
-
32
-
33
-
34
-
35
-
36
-
37
-
38
-
39
-
40
-
41
-
42
-
43
-
44
-
45
-
46
-
47
-
48
-
49
-
50
-
51
-
52
-
53
-
54
-
55
-
56
-
57
-
58
-
59
-
60
-
61
-
62
-
63
-
64
-
65
-
66
-
67
-
68
-
69
-
70
-
71
-
72
-
73
-
74
-
75
-
76
-
77
-
78
-
79
-
80
-
81
-
82
-
83
-
84
-
85
-
86
-
87
-
88
-
89
-
90
-
91
-
92
-
93
-
94
-
95
-
96
-
97
-
98
-
99
-
100
-
101
-
102
-
103
-
104
-
105
-
106
-
107
-
108
-
109
-
110
-
111
-
112
-
113
-
114
-
115
-
116
-
117
-
118
-
119
-
120
-
121
-
122
-
123
-
124
-
125
-
126
-
127
-
128
-
129
-
130
-
131
-
132
-
133
-
134
-
135
-
136
-
137
-
138
-
139
-
140
-
141
-
142
-
143
-
144
-
145
-
146
-
147
-
148
-
149
-
150
-
151
-
152
-
153
-
154
-
155
-
156
-
157
-
158
-
159
-
160
-
161
-
162
-
163
-
164
-
165
-
166
-
167
-
168
-
169
-
170
-
171
-
172
-
173
-
174
-
175
-
176
-
177
-
178
-
179
-
180
-
181
-
182
-
183
-
184
-
185
-
186
-
 187
187 -
 188
188 -
 189
189 -
 190
190 -
 191
191 -
 192
192 -
 193
193 -
 194
194 -
 195
195 -
 196
196 -
 197
197 -
 198
198 -
 199
199 -
 200
200 -
 201
201 -
 202
202 -
 203
203 -
 204
204 -
 205
205 -
 206
206 -
 207
207 -
208
-
209
-
210
-
211
-
212
-
213
-
214
-
215
-
216
-
217
-
218
-
219
-
220
-
221
-
222
-
223
-
224
-
225
-
226
-
227
-
228
-
229
-
230
-
231
-
232
-
233
-
234
-
235
-
236
-
237
-
238
-
239
-
240
-
241
-
242
-
243
-
244
-
245
-
246
-
247
-
248
-
249
-
250
-
251
-
252
-
253
-
254
-
255
-
256
-
257
-
258
-
259
-
260
-
261
-
262
-
263
-
264
-
265
-
266
-
267
-
268
-
269
-
270
-
271
-
272
-
273
-
274
-
275
-
276
-
277
-
278
-
279
-
280
-
281
-
282
-
283
-
284
-
285
-
286
-
287
-
288
-
289
-
290
-
291
-
292
-
293
-
294
-
295
-
296
-
297
-
298
-
299
-
300
-
301
-
302
-
303
-
304
-
305
-
306
-
307
-
308
-
309
-
310
-
311
-
312
-
313
-
314
-
315
-
316
-
317
-
318
-
319
-
320
-
321
-
322
-
323
-
324
-
325
-
326
-
327
-
328
-
329
-
330
-
331
-
332
-
333
-
334
-
335
-
336
-
337
-
338
-
339
-
340
-
341
-
342
-
343
-
344
-
345
-
346
-
347
-
348
-
349
-
350
-
351
-
352
-
353
-
354
-
355
-
356
-
357
-
358
-
359
-
360
-
361
-
362
-
363
-
364
-
365
-
366
-
367
-
368
-
369
-
370
-
371
-
372
-
373
-
374
-
375
-
376
-
377
-
378
-
379
-
380
-
381
-
382
-
383
-
384
-
385
-
386
-
387
-
388
-
389
-
390
-
391
-
392
-
393
-
394
-
395
-
396
-
397
-
398
-
399
-
400
-
401
-
402
 |
 |
FIAT GROUP
CONSOLIDATED
FINANCIAL
STATEMENTS
AT 31 DECEMBER
2010
NOTES
196
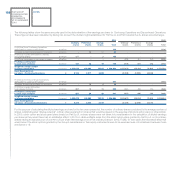
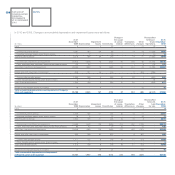
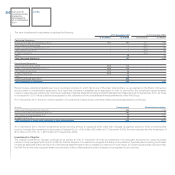
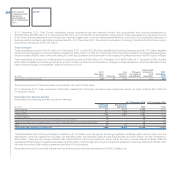
Change in
At 31 the scope Reclassified
At 31
December Impairment of conso- Translation Other to Assets December
(€ million) 2008 Additions Depreciation losses Divestitures lidation differences changes held for sale 2009
Land 588 - - - - 5 8 2 - 603
Owned industrial buildings 2,571 146 (155) (21) (10) 24 71 120 - 2,746
Industrial buildings leased
under finance leases 58 - (3) - - 8 - (4) -
59
Total Industrial buildings 2,629 146 (158) (21) (10) 32 71 116 - 2,805
Owned plant, machinery
and equipment 6,267 1,095 (1,443) (126) (31) 14 214 520 - 6,510
Plant, machinery and equipment
leased under finance leases 248 38 (42) - - (1) - (7) -
236
Total Plant, machinery and equipment 6,515 1,133 (1,485) (126) (31) 13 214 513 - 6,746
Assets sold with a buy-back
commitment 1,062 244 (135) (32) (73) - 8 (164) - 910
Owned other tangible assets 465 188 (125) (8) (90) 3 16 46 - 495
Other tangible assets leased
under finance leases 4 6 (1) - - - - - -
9
Total Other tangible assets 469 194 (126) (8) (90) 3 16 46 - 504
Advances and tangible assets
in progress 1,252 723 - (19) (7) - 84 (656) - 1,377
Total net carrying amount of
Property, plant and equipment 12,515 2,440 (1,904) (206) (211) 53 401 (143) - 12,945
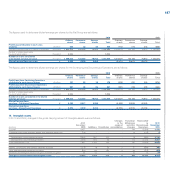
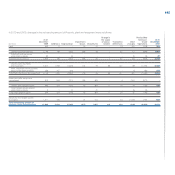
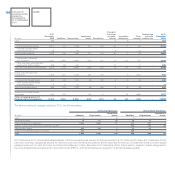
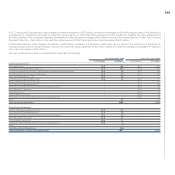
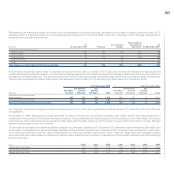
The above mentioned changes include for 2010, the following items:
Continuing Operations Discontinued Operations
Impairment Impairment
(€ million) Additions Depreciation losses Additions Depreciation losses
Land 1 - 2 1 - -
Industrial Buildings 70 111 59 29 73 -
Plant, machinery and equipment 1,054 1,282 71 151 310 2
Patents, concessions and licenses externally acquired - - - 344 131 26
Other tangible assets 199 100 3 25 36 -
Advances and tangible assets in progress 530 - 4 200 - -
Total 1,854 1,493 139 750 550 28
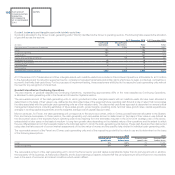
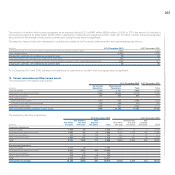
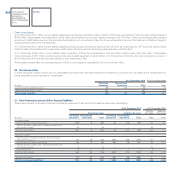
At 31 December 2010, land and industrial buildings of the Group pledged as security for debt amounted to €137 million (€135 million at 31 December 2009);
plant and machinery pledged as security for debt and other commitments amounted to €318 million (€244 million at 31 December 2009) and other assets
pledged as security for debt and other commitments totalled €10 million (€9 million at 31 December 2009); these relate to suppliers’ assets recognised in
the consolidated financial statements in accordance with IFRIC 4, with the simultaneous recognition of a financial lease payable.