Chrysler 2010 Annual Report Download - page 196
Download and view the complete annual report
Please find page 196 of the 2010 Chrysler annual report below. You can navigate through the pages in the report by either clicking on the pages listed below, or by using the keyword search tool below to find specific information within the annual report.-
 1
1 -
2
-
3
-
4
-
5
-
6
-
7
-
8
-
9
-
10
-
11
-
12
-
13
-
14
-
15
-
16
-
17
-
18
-
19
-
20
-
21
-
22
-
23
-
24
-
25
-
26
-
27
-
28
-
29
-
30
-
31
-
32
-
33
-
34
-
35
-
36
-
37
-
38
-
39
-
40
-
41
-
42
-
43
-
44
-
45
-
46
-
47
-
48
-
49
-
50
-
51
-
52
-
53
-
54
-
55
-
56
-
57
-
58
-
59
-
60
-
61
-
62
-
63
-
64
-
65
-
66
-
67
-
68
-
69
-
70
-
71
-
72
-
73
-
74
-
75
-
76
-
77
-
78
-
79
-
80
-
81
-
82
-
83
-
84
-
85
-
86
-
87
-
88
-
89
-
90
-
91
-
92
-
93
-
94
-
95
-
96
-
97
-
98
-
99
-
100
-
101
-
102
-
103
-
104
-
105
-
106
-
107
-
108
-
109
-
110
-
111
-
112
-
113
-
114
-
115
-
116
-
117
-
118
-
119
-
120
-
121
-
122
-
123
-
124
-
125
-
126
-
127
-
128
-
129
-
130
-
131
-
132
-
133
-
134
-
135
-
136
-
137
-
138
-
139
-
140
-
141
-
142
-
143
-
144
-
145
-
146
-
147
-
148
-
149
-
150
-
151
-
152
-
153
-
154
-
155
-
156
-
157
-
158
-
159
-
160
-
161
-
162
-
163
-
164
-
165
-
166
-
167
-
168
-
169
-
170
-
171
-
172
-
173
-
174
-
175
-
176
-
177
-
178
-
179
-
180
-
181
-
182
-
183
-
184
-
185
-
 186
186 -
 187
187 -
 188
188 -
 189
189 -
 190
190 -
 191
191 -
 192
192 -
 193
193 -
 194
194 -
 195
195 -
 196
196 -
 197
197 -
 198
198 -
 199
199 -
 200
200 -
 201
201 -
 202
202 -
 203
203 -
 204
204 -
 205
205 -
 206
206 -
207
-
208
-
209
-
210
-
211
-
212
-
213
-
214
-
215
-
216
-
217
-
218
-
219
-
220
-
221
-
222
-
223
-
224
-
225
-
226
-
227
-
228
-
229
-
230
-
231
-
232
-
233
-
234
-
235
-
236
-
237
-
238
-
239
-
240
-
241
-
242
-
243
-
244
-
245
-
246
-
247
-
248
-
249
-
250
-
251
-
252
-
253
-
254
-
255
-
256
-
257
-
258
-
259
-
260
-
261
-
262
-
263
-
264
-
265
-
266
-
267
-
268
-
269
-
270
-
271
-
272
-
273
-
274
-
275
-
276
-
277
-
278
-
279
-
280
-
281
-
282
-
283
-
284
-
285
-
286
-
287
-
288
-
289
-
290
-
291
-
292
-
293
-
294
-
295
-
296
-
297
-
298
-
299
-
300
-
301
-
302
-
303
-
304
-
305
-
306
-
307
-
308
-
309
-
310
-
311
-
312
-
313
-
314
-
315
-
316
-
317
-
318
-
319
-
320
-
321
-
322
-
323
-
324
-
325
-
326
-
327
-
328
-
329
-
330
-
331
-
332
-
333
-
334
-
335
-
336
-
337
-
338
-
339
-
340
-
341
-
342
-
343
-
344
-
345
-
346
-
347
-
348
-
349
-
350
-
351
-
352
-
353
-
354
-
355
-
356
-
357
-
358
-
359
-
360
-
361
-
362
-
363
-
364
-
365
-
366
-
367
-
368
-
369
-
370
-
371
-
372
-
373
-
374
-
375
-
376
-
377
-
378
-
379
-
380
-
381
-
382
-
383
-
384
-
385
-
386
-
387
-
388
-
389
-
390
-
391
-
392
-
393
-
394
-
395
-
396
-
397
-
398
-
399
-
400
-
401
-
402
 |
 |

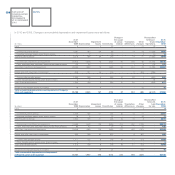
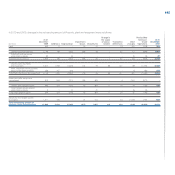
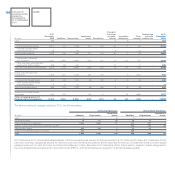
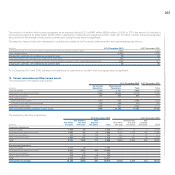
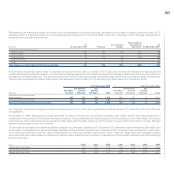
195
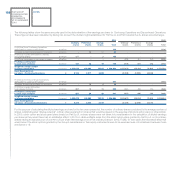
In 2010 and 2009, changes in the net carrying amount of Property, plant and equipment were as follows:
Change in Reclassified
At 31 the scope to Discon-
At 31
December Impairment of conso- Translation Other tinued December
(€ million) 2009 Additions Depreciation losses Divestitures lidation differences changes Operations 2010
Land 603 2 - (2) (2) - 13 (41) (208) 365
Owned industrial buildings 2,746 99 (182) (59) (3) 7 87 171 (899) 1,967
Industrial buildings leased
under finance leases 59 - (2) - - - - (1) (9) 47
Total Industrial buildings 2,805 99 (184) (59) (3) 7 87 170 (908) 2,014
Owned plant, machinery
and equipment 6,510 1,098 (1,548) (73) (9) 88 227 789 (1,494) 5,588
Plant, machinery and equipment
leased under finance leases 236 107 (44) - - - - 12 (36) 275
Total Plant, machinery and equipment 6,746 1,205 (1,592) (73) (9) 88 227 801 (1,530) 5,863
Assets sold with a buy-back
commitment 910 344 (131) (26) (63) - 4 (167) (871) -
Owned other tangible assets 495 223 (135) (3) (95) 11 20 42 (142) 416
Other tangible assets leased
under finance leases 9 1 (1) - (1) - - (5) (3) -
Total Other tangible assets 504 224 (136) (3) (96) 11 20 37 (145) 416
Advances and tangible assets
in progress 1,377 730 - (4) (14) 7 50 (1,009) (194) 943
Total net carrying amount of
Property, plant and equipment 12,945 2,604 (2,043) (167) (187) 113 401 (209) (3,856) 9,601