Chrysler 2010 Annual Report Download - page 224
Download and view the complete annual report
Please find page 224 of the 2010 Chrysler annual report below. You can navigate through the pages in the report by either clicking on the pages listed below, or by using the keyword search tool below to find specific information within the annual report.-
 1
1 -
2
-
3
-
4
-
5
-
6
-
7
-
8
-
9
-
10
-
11
-
12
-
13
-
14
-
15
-
16
-
17
-
18
-
19
-
20
-
21
-
22
-
23
-
24
-
25
-
26
-
27
-
28
-
29
-
30
-
31
-
32
-
33
-
34
-
35
-
36
-
37
-
38
-
39
-
40
-
41
-
42
-
43
-
44
-
45
-
46
-
47
-
48
-
49
-
50
-
51
-
52
-
53
-
54
-
55
-
56
-
57
-
58
-
59
-
60
-
61
-
62
-
63
-
64
-
65
-
66
-
67
-
68
-
69
-
70
-
71
-
72
-
73
-
74
-
75
-
76
-
77
-
78
-
79
-
80
-
81
-
82
-
83
-
84
-
85
-
86
-
87
-
88
-
89
-
90
-
91
-
92
-
93
-
94
-
95
-
96
-
97
-
98
-
99
-
100
-
101
-
102
-
103
-
104
-
105
-
106
-
107
-
108
-
109
-
110
-
111
-
112
-
113
-
114
-
115
-
116
-
117
-
118
-
119
-
120
-
121
-
122
-
123
-
124
-
125
-
126
-
127
-
128
-
129
-
130
-
131
-
132
-
133
-
134
-
135
-
136
-
137
-
138
-
139
-
140
-
141
-
142
-
143
-
144
-
145
-
146
-
147
-
148
-
149
-
150
-
151
-
152
-
153
-
154
-
155
-
156
-
157
-
158
-
159
-
160
-
161
-
162
-
163
-
164
-
165
-
166
-
167
-
168
-
169
-
170
-
171
-
172
-
173
-
174
-
175
-
176
-
177
-
178
-
179
-
180
-
181
-
182
-
183
-
184
-
185
-
186
-
187
-
188
-
189
-
190
-
191
-
192
-
193
-
194
-
195
-
196
-
197
-
198
-
199
-
200
-
201
-
202
-
203
-
204
-
205
-
206
-
207
-
208
-
209
-
210
-
211
-
212
-
213
-
 214
214 -
 215
215 -
 216
216 -
 217
217 -
 218
218 -
 219
219 -
 220
220 -
 221
221 -
 222
222 -
 223
223 -
 224
224 -
 225
225 -
 226
226 -
 227
227 -
 228
228 -
 229
229 -
 230
230 -
 231
231 -
 232
232 -
 233
233 -
 234
234 -
235
-
236
-
237
-
238
-
239
-
240
-
241
-
242
-
243
-
244
-
245
-
246
-
247
-
248
-
249
-
250
-
251
-
252
-
253
-
254
-
255
-
256
-
257
-
258
-
259
-
260
-
261
-
262
-
263
-
264
-
265
-
266
-
267
-
268
-
269
-
270
-
271
-
272
-
273
-
274
-
275
-
276
-
277
-
278
-
279
-
280
-
281
-
282
-
283
-
284
-
285
-
286
-
287
-
288
-
289
-
290
-
291
-
292
-
293
-
294
-
295
-
296
-
297
-
298
-
299
-
300
-
301
-
302
-
303
-
304
-
305
-
306
-
307
-
308
-
309
-
310
-
311
-
312
-
313
-
314
-
315
-
316
-
317
-
318
-
319
-
320
-
321
-
322
-
323
-
324
-
325
-
326
-
327
-
328
-
329
-
330
-
331
-
332
-
333
-
334
-
335
-
336
-
337
-
338
-
339
-
340
-
341
-
342
-
343
-
344
-
345
-
346
-
347
-
348
-
349
-
350
-
351
-
352
-
353
-
354
-
355
-
356
-
357
-
358
-
359
-
360
-
361
-
362
-
363
-
364
-
365
-
366
-
367
-
368
-
369
-
370
-
371
-
372
-
373
-
374
-
375
-
376
-
377
-
378
-
379
-
380
-
381
-
382
-
383
-
384
-
385
-
386
-
387
-
388
-
389
-
390
-
391
-
392
-
393
-
394
-
395
-
396
-
397
-
398
-
399
-
400
-
401
-
402
 |
 |

223
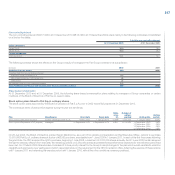
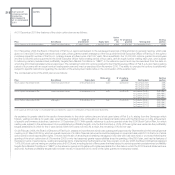
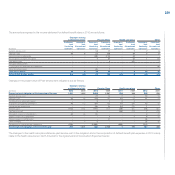
The following table summarises outstanding stock options under the CNH EIP:
At 31 December 2010 At 31 December 2009
Weighted Average
Number of remaining Average Number of Average
options Contractual life Exercise Price options Exercise Price
Exercise price (in USD) Outstanding (in years) (in USD) Outstanding (in USD)
13.58 - 19.99 1,536,464 4.0 13.66 2,243,243 13.70
20.00 - 29.99 53,333 1.2 21.20 186,760 21.20
30.00 - 39.99 3,734,654 4.4 33.00 1,256,178 37.21
40.00 - 68.85 464,520 2.9 49.33 646,654 52.80
Total 5,788,971 4,332,835
Changes during the period in all CNH stock option plans are as follows:
2010 2009
Average Average
Number of exercise price Number of exercise price
shares (in USD) shares (in USD)
Outstanding at the beginning of the year 4,332,835 26.67 2,718,109 40.82
Granted 2,888,625 31.69 4,144,800 13.58
Forfeited (324,494) 31.91 (2,404,528) 18.06
Exercised (992,535) 20.69 (8,136) 18.65
Expired (115,460) 68.85 (117,410) 68.85
Outstanding at the end of the year 5,788,971 29.07 4,332,835 26.67
Exercisable at the end of the year 1,431,524 36.40 1,488,840 37.81
Performance Share Grants
Under the CNH EIP, performance-based shares may also be granted to selected key employees and executive officers. CNH establishes the period and
conditions of performance for each award. Performance-based shares vest upon the attainment of specified performance objectives.
In September 2010, CNH granted approximately 2 million performance-based, non-vested share awards under the CNH EIP. These performance shares
will vest in three equal instalments if specified targets are achieved on a cumulative basis during the three-, four- and five-year periods ending 31 December
2012, 2013 and 2014. The fair value of this award is US$34.74 per share.
CNH granted performance-based, non-vested share awards under the Top Performance Plan (“TPP”) in 2006 through 2009. Vesting of the TPP performance
shares was dependent on achievement of specified targets by 2010. In 2006 and 2007, CNH recognised expense for TPP awards based on an assumption
that the specified performance targets would be achieved in 2009. In 2008, CNH determined achievement of these performance targets to be improbable and
CNH reversed all previously recognised stock-based compensation expense for an amount of €7 million (US$11 million). Achievement of the performance
targets did not occur in either 2009 or 2010 and these awards were forfeited. CNH did not recognise any stock-based compensation expense related to
TPP awards in 2009 or 2010.