Chrysler 2010 Annual Report Download - page 139
Download and view the complete annual report
Please find page 139 of the 2010 Chrysler annual report below. You can navigate through the pages in the report by either clicking on the pages listed below, or by using the keyword search tool below to find specific information within the annual report.-
 1
1 -
2
-
3
-
4
-
5
-
6
-
7
-
8
-
9
-
10
-
11
-
12
-
13
-
14
-
15
-
16
-
17
-
18
-
19
-
20
-
21
-
22
-
23
-
24
-
25
-
26
-
27
-
28
-
29
-
30
-
31
-
32
-
33
-
34
-
35
-
36
-
37
-
38
-
39
-
40
-
41
-
42
-
43
-
44
-
45
-
46
-
47
-
48
-
49
-
50
-
51
-
52
-
53
-
54
-
55
-
56
-
57
-
58
-
59
-
60
-
61
-
62
-
63
-
64
-
65
-
66
-
67
-
68
-
69
-
70
-
71
-
72
-
73
-
74
-
75
-
76
-
77
-
78
-
79
-
80
-
81
-
82
-
83
-
84
-
85
-
86
-
87
-
88
-
89
-
90
-
91
-
92
-
93
-
94
-
95
-
96
-
97
-
98
-
99
-
100
-
101
-
102
-
103
-
104
-
105
-
106
-
107
-
108
-
109
-
110
-
111
-
112
-
113
-
114
-
115
-
116
-
117
-
118
-
119
-
120
-
121
-
122
-
123
-
124
-
125
-
126
-
127
-
128
-
 129
129 -
 130
130 -
 131
131 -
 132
132 -
 133
133 -
 134
134 -
 135
135 -
 136
136 -
 137
137 -
 138
138 -
 139
139 -
 140
140 -
 141
141 -
 142
142 -
 143
143 -
 144
144 -
 145
145 -
 146
146 -
 147
147 -
 148
148 -
 149
149 -
150
-
151
-
152
-
153
-
154
-
155
-
156
-
157
-
158
-
159
-
160
-
161
-
162
-
163
-
164
-
165
-
166
-
167
-
168
-
169
-
170
-
171
-
172
-
173
-
174
-
175
-
176
-
177
-
178
-
179
-
180
-
181
-
182
-
183
-
184
-
185
-
186
-
187
-
188
-
189
-
190
-
191
-
192
-
193
-
194
-
195
-
196
-
197
-
198
-
199
-
200
-
201
-
202
-
203
-
204
-
205
-
206
-
207
-
208
-
209
-
210
-
211
-
212
-
213
-
214
-
215
-
216
-
217
-
218
-
219
-
220
-
221
-
222
-
223
-
224
-
225
-
226
-
227
-
228
-
229
-
230
-
231
-
232
-
233
-
234
-
235
-
236
-
237
-
238
-
239
-
240
-
241
-
242
-
243
-
244
-
245
-
246
-
247
-
248
-
249
-
250
-
251
-
252
-
253
-
254
-
255
-
256
-
257
-
258
-
259
-
260
-
261
-
262
-
263
-
264
-
265
-
266
-
267
-
268
-
269
-
270
-
271
-
272
-
273
-
274
-
275
-
276
-
277
-
278
-
279
-
280
-
281
-
282
-
283
-
284
-
285
-
286
-
287
-
288
-
289
-
290
-
291
-
292
-
293
-
294
-
295
-
296
-
297
-
298
-
299
-
300
-
301
-
302
-
303
-
304
-
305
-
306
-
307
-
308
-
309
-
310
-
311
-
312
-
313
-
314
-
315
-
316
-
317
-
318
-
319
-
320
-
321
-
322
-
323
-
324
-
325
-
326
-
327
-
328
-
329
-
330
-
331
-
332
-
333
-
334
-
335
-
336
-
337
-
338
-
339
-
340
-
341
-
342
-
343
-
344
-
345
-
346
-
347
-
348
-
349
-
350
-
351
-
352
-
353
-
354
-
355
-
356
-
357
-
358
-
359
-
360
-
361
-
362
-
363
-
364
-
365
-
366
-
367
-
368
-
369
-
370
-
371
-
372
-
373
-
374
-
375
-
376
-
377
-
378
-
379
-
380
-
381
-
382
-
383
-
384
-
385
-
386
-
387
-
388
-
389
-
390
-
391
-
392
-
393
-
394
-
395
-
396
-
397
-
398
-
399
-
400
-
401
-
402
 |
 |

138 FIAT GROUP
CONSOLIDATED
FINANCIAL
STATEMENTS
AT 31 DECEMBER
2010
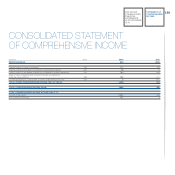
INCOME
STATEMENT
(€ million) Note 2010 2009 (**)
Net revenues (1) 35,880 32,684
Cost of sales (2) 30,718 28,252
Selling, general and administrative costs (3) 2,956 2,673
Research and development costs (4) 1,013 1,010
Other income (expenses) (5) (81) (13)
TRADING PROFIT/(LOSS) 1,112 736
Gains (losses) on the disposal of investments (6) 12 3
Restructuring costs (7) 118 168
Other unusual income (expenses) (8) (14) (193)
OPERATING PROFIT/(LOSS) 992 378
Financial income (expenses) (9) (400) (352)
Result from investments: (10) 114 77
Share of the profit/(loss) of investees accounted for using the equity method 120 65
Other income (expenses) from investments (6) 12
PROFIT/(LOSS) BEFORE TAXES 706 103
Income taxes (11) 484 448
PROFIT/(LOSS) FROM CONTINUING OPERATIONS 222 (345)
Post tax profit/(loss) from Discontinued Operations (A) 378 (503)
PROFIT/(LOSS) 600 (848)
PROFIT/(LOSS) ATTRIBUTABLE TO:
Owners of the parent 520 (838)
Non-controlling interests 80 (10)
PROFIT/(LOSS) FROM CONTINUING OPERATION ATTRIBUTABLE TO:
Owners of the parent 179 (374)
Non-controlling interests 43 29
(in €)
BASIC EARNINGS/(LOSS) PER ORDINARY AND PREFERENCE SHARE (13) 0.410 (0.677)
BASIC EARNINGS/(LOSS) PER SAVINGS SHARE (13) 0.565 (0.677)
DILUTED EARNINGS/(LOSS) PER ORDINARY AND PREFERENCE SHARE (13) 0.409 (0.677)
DILUTED EARNINGS/(LOSS) PER SAVINGS SHARE (13) 0.564 (0.677)
(*) Pursuant to Consob Resolution No. 15519 of 27 July 2006, the effects of related party transactions on the consolidated income statement are presented in the specific Income Statement schedule
provided in the following pages and are further described in Note 34.
(**) In accordance with IFRS 5 the figures for 2009 have been reclassified.
(A) Post tax profit/(loss) from Discontinued Operations is presented in the section Assets and Liabilities held for sale and Discontinued Operations.
CONSOLIDATED INCOME STATEMENT(*)