Chrysler 2010 Annual Report Download - page 262
Download and view the complete annual report
Please find page 262 of the 2010 Chrysler annual report below. You can navigate through the pages in the report by either clicking on the pages listed below, or by using the keyword search tool below to find specific information within the annual report.-
 1
1 -
2
-
3
-
4
-
5
-
6
-
7
-
8
-
9
-
10
-
11
-
12
-
13
-
14
-
15
-
16
-
17
-
18
-
19
-
20
-
21
-
22
-
23
-
24
-
25
-
26
-
27
-
28
-
29
-
30
-
31
-
32
-
33
-
34
-
35
-
36
-
37
-
38
-
39
-
40
-
41
-
42
-
43
-
44
-
45
-
46
-
47
-
48
-
49
-
50
-
51
-
52
-
53
-
54
-
55
-
56
-
57
-
58
-
59
-
60
-
61
-
62
-
63
-
64
-
65
-
66
-
67
-
68
-
69
-
70
-
71
-
72
-
73
-
74
-
75
-
76
-
77
-
78
-
79
-
80
-
81
-
82
-
83
-
84
-
85
-
86
-
87
-
88
-
89
-
90
-
91
-
92
-
93
-
94
-
95
-
96
-
97
-
98
-
99
-
100
-
101
-
102
-
103
-
104
-
105
-
106
-
107
-
108
-
109
-
110
-
111
-
112
-
113
-
114
-
115
-
116
-
117
-
118
-
119
-
120
-
121
-
122
-
123
-
124
-
125
-
126
-
127
-
128
-
129
-
130
-
131
-
132
-
133
-
134
-
135
-
136
-
137
-
138
-
139
-
140
-
141
-
142
-
143
-
144
-
145
-
146
-
147
-
148
-
149
-
150
-
151
-
152
-
153
-
154
-
155
-
156
-
157
-
158
-
159
-
160
-
161
-
162
-
163
-
164
-
165
-
166
-
167
-
168
-
169
-
170
-
171
-
172
-
173
-
174
-
175
-
176
-
177
-
178
-
179
-
180
-
181
-
182
-
183
-
184
-
185
-
186
-
187
-
188
-
189
-
190
-
191
-
192
-
193
-
194
-
195
-
196
-
197
-
198
-
199
-
200
-
201
-
202
-
203
-
204
-
205
-
206
-
207
-
208
-
209
-
210
-
211
-
212
-
213
-
214
-
215
-
216
-
217
-
218
-
219
-
220
-
221
-
222
-
223
-
224
-
225
-
226
-
227
-
228
-
229
-
230
-
231
-
232
-
233
-
234
-
235
-
236
-
237
-
238
-
239
-
240
-
241
-
242
-
243
-
244
-
245
-
246
-
247
-
248
-
249
-
250
-
251
-
 252
252 -
 253
253 -
 254
254 -
 255
255 -
 256
256 -
 257
257 -
 258
258 -
 259
259 -
 260
260 -
 261
261 -
 262
262 -
 263
263 -
 264
264 -
 265
265 -
 266
266 -
 267
267 -
 268
268 -
 269
269 -
 270
270 -
 271
271 -
 272
272 -
273
-
274
-
275
-
276
-
277
-
278
-
279
-
280
-
281
-
282
-
283
-
284
-
285
-
286
-
287
-
288
-
289
-
290
-
291
-
292
-
293
-
294
-
295
-
296
-
297
-
298
-
299
-
300
-
301
-
302
-
303
-
304
-
305
-
306
-
307
-
308
-
309
-
310
-
311
-
312
-
313
-
314
-
315
-
316
-
317
-
318
-
319
-
320
-
321
-
322
-
323
-
324
-
325
-
326
-
327
-
328
-
329
-
330
-
331
-
332
-
333
-
334
-
335
-
336
-
337
-
338
-
339
-
340
-
341
-
342
-
343
-
344
-
345
-
346
-
347
-
348
-
349
-
350
-
351
-
352
-
353
-
354
-
355
-
356
-
357
-
358
-
359
-
360
-
361
-
362
-
363
-
364
-
365
-
366
-
367
-
368
-
369
-
370
-
371
-
372
-
373
-
374
-
375
-
376
-
377
-
378
-
379
-
380
-
381
-
382
-
383
-
384
-
385
-
386
-
387
-
388
-
389
-
390
-
391
-
392
-
393
-
394
-
395
-
396
-
397
-
398
-
399
-
400
-
401
-
402
 |
 |

261
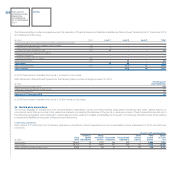
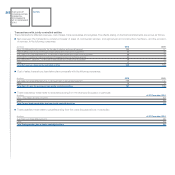
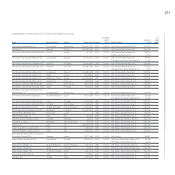
Discontinued Operations
With respect to Profit/(loss) from Discontinued Operations, the effects of such transactions on the consolidated income statements for 2010 and 2009
are as follows:
of which: with related parties
Unconso- Jointly Other Total Effect
Total lidated controlled Associated Continuing related related on Total
(€ million) 2010 Subsidiaries entities companies Operations parties parties (%)
Net revenues 21,342 - 249 238 718 - 1,205 5.6%
Cost of sales 17,979 - 187 154 342 3 686 3.8%
Selling, general and administrative costs 1,793 - - - 155 7 162 9.0%
of which: with related parties
Unconso- Jointly Other Total Effect
Total lidated controlled Associated Continuing related related on Total
(€ million) 2009 Subsidiaries entities companies Operations parties parties (%)
Net revenues 17,968 - 191 202 444 - 837 4.7%
Cost of sales 15,549 - 156 118 162 3 439 2.8%
Selling, general and administrative costs 1,636 - - - 167 13 180 11.0%
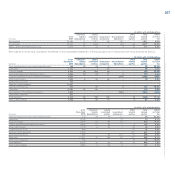
With reference to Discontinued Operations, the effects on the consolidated statement of financial position at 31 December 2010 are as follows:
of which: with related parties
At 31 Unconso- Jointly Other Total Effect
December lidated controlled Associated Continuing related related on Total
(€ million) 2010 Subsidiaries entities companies Operations parties parties (%)
Other investments and non-current financial assets 58 1 - 11 - - 12 20.7%
Trade receivables 1,791 3 78 63 19 - 163 9.1%
Current receivables from financing activities 10,908 - - - - - - -
Financial receivables from Continuing Operations 2,865 - - - 2,865 - 2,865 100%
Current tax receivables 552 - - - - - - -
Other current assets 112 - - - - - - -
Current financial assets 3,686 - - - - - - -
Cash and cash equivalents 8,321 - - 219 - - 219 2.6%
Asset-backed financing 4,748 - 1 49 5 - 55 1.2%
Debt payable to Continuing Operations 5,626 - - - 5,626 - 5,626 100%
Other debt 147 - - - - - - -
Other financial liabilities 3,906 1 38 39 10 1 89 2.3%
Trade payables 503 - - - - - - -
Current tax payables 2,342 - 48 - - - 48 2.0%