Chrysler 2010 Annual Report Download - page 210
Download and view the complete annual report
Please find page 210 of the 2010 Chrysler annual report below. You can navigate through the pages in the report by either clicking on the pages listed below, or by using the keyword search tool below to find specific information within the annual report.-
 1
1 -
2
-
3
-
4
-
5
-
6
-
7
-
8
-
9
-
10
-
11
-
12
-
13
-
14
-
15
-
16
-
17
-
18
-
19
-
20
-
21
-
22
-
23
-
24
-
25
-
26
-
27
-
28
-
29
-
30
-
31
-
32
-
33
-
34
-
35
-
36
-
37
-
38
-
39
-
40
-
41
-
42
-
43
-
44
-
45
-
46
-
47
-
48
-
49
-
50
-
51
-
52
-
53
-
54
-
55
-
56
-
57
-
58
-
59
-
60
-
61
-
62
-
63
-
64
-
65
-
66
-
67
-
68
-
69
-
70
-
71
-
72
-
73
-
74
-
75
-
76
-
77
-
78
-
79
-
80
-
81
-
82
-
83
-
84
-
85
-
86
-
87
-
88
-
89
-
90
-
91
-
92
-
93
-
94
-
95
-
96
-
97
-
98
-
99
-
100
-
101
-
102
-
103
-
104
-
105
-
106
-
107
-
108
-
109
-
110
-
111
-
112
-
113
-
114
-
115
-
116
-
117
-
118
-
119
-
120
-
121
-
122
-
123
-
124
-
125
-
126
-
127
-
128
-
129
-
130
-
131
-
132
-
133
-
134
-
135
-
136
-
137
-
138
-
139
-
140
-
141
-
142
-
143
-
144
-
145
-
146
-
147
-
148
-
149
-
150
-
151
-
152
-
153
-
154
-
155
-
156
-
157
-
158
-
159
-
160
-
161
-
162
-
163
-
164
-
165
-
166
-
167
-
168
-
169
-
170
-
171
-
172
-
173
-
174
-
175
-
176
-
177
-
178
-
179
-
180
-
181
-
182
-
183
-
184
-
185
-
186
-
187
-
188
-
189
-
190
-
191
-
192
-
193
-
194
-
195
-
196
-
197
-
198
-
199
-
 200
200 -
 201
201 -
 202
202 -
 203
203 -
 204
204 -
 205
205 -
 206
206 -
 207
207 -
 208
208 -
 209
209 -
 210
210 -
 211
211 -
 212
212 -
 213
213 -
 214
214 -
 215
215 -
 216
216 -
 217
217 -
 218
218 -
 219
219 -
 220
220 -
221
-
222
-
223
-
224
-
225
-
226
-
227
-
228
-
229
-
230
-
231
-
232
-
233
-
234
-
235
-
236
-
237
-
238
-
239
-
240
-
241
-
242
-
243
-
244
-
245
-
246
-
247
-
248
-
249
-
250
-
251
-
252
-
253
-
254
-
255
-
256
-
257
-
258
-
259
-
260
-
261
-
262
-
263
-
264
-
265
-
266
-
267
-
268
-
269
-
270
-
271
-
272
-
273
-
274
-
275
-
276
-
277
-
278
-
279
-
280
-
281
-
282
-
283
-
284
-
285
-
286
-
287
-
288
-
289
-
290
-
291
-
292
-
293
-
294
-
295
-
296
-
297
-
298
-
299
-
300
-
301
-
302
-
303
-
304
-
305
-
306
-
307
-
308
-
309
-
310
-
311
-
312
-
313
-
314
-
315
-
316
-
317
-
318
-
319
-
320
-
321
-
322
-
323
-
324
-
325
-
326
-
327
-
328
-
329
-
330
-
331
-
332
-
333
-
334
-
335
-
336
-
337
-
338
-
339
-
340
-
341
-
342
-
343
-
344
-
345
-
346
-
347
-
348
-
349
-
350
-
351
-
352
-
353
-
354
-
355
-
356
-
357
-
358
-
359
-
360
-
361
-
362
-
363
-
364
-
365
-
366
-
367
-
368
-
369
-
370
-
371
-
372
-
373
-
374
-
375
-
376
-
377
-
378
-
379
-
380
-
381
-
382
-
383
-
384
-
385
-
386
-
387
-
388
-
389
-
390
-
391
-
392
-
393
-
394
-
395
-
396
-
397
-
398
-
399
-
400
-
401
-
402
 |
 |

209
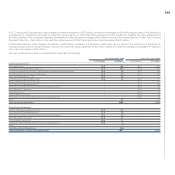
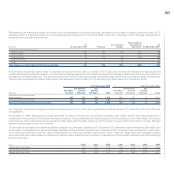
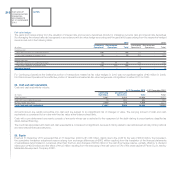
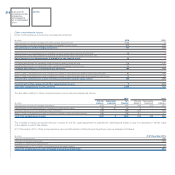
In respect of derivative financial instruments arranged by Continuing Operations, in 2010 the Group transferred losses of €168 million (losses of €279 million
in 2009) to income, net of the tax effect, previously recognised directly in other comprehensive income. In respect of derivative financial instruments arranged
by Discontinued Operations, in 2010 the Group transferred losses of €93 million (losses of €31 million in 2009) to income, net of the tax effect, previously
recognised directly in other comprehensive income. These items are reported in the following lines:
2010 2009
Continuing Discontinued Continuing Discontinued
(€ million) Operations Operations Total Operations Operations Total
Currency risk
Increase (Decrease) in Net revenues (64) (27) (91) (19) 4 (15)
Decrease (Increase) in Cost of sales (83) (29) (112) (328) (22) (350)
Financial income (expenses) (19) (29) (48) 82 (11) 71
Result from investments (5) - (5) - - -
Interest rate risk
Decrease (Increase) in Cost of sales (8) (36) (44) (6) (10) (16)
Result from investments (7) - (7) 3 - 3
Financial income (expenses) (5) - (5) (17) - (17)
Commodities price risk
Decrease (Increase) in Cost of sales 5 - 5 (5) - (5)
Taxes income (expenses) 37 28 65 3 8 11
Ineffectiveness - overhedges (19) - (19) 8 - 8
Total recognised in the income statement (168) (93) (261) (279) (31) (310)
The ineffectiveness of cash flow hedges was not material in 2010 or 2009.
In 2010 there was an overall negative economic effect of €19 million (positive effect of €8 million in 2009) from hedges of assets and liabilities relating to
Continuing Operations, which subsequently turned out to be in excess of the future flows being hedged (overhedges); this was mainly due to the loss of
certain exposures to interest rate risk. The effect of hedges of assets and liabilities relating to Discontinued Operations which subsequently turned out to be
in excess of the future flows being hedged (overhedges) was not material in 2010 or 2009.