Chrysler 2010 Annual Report Download - page 77
Download and view the complete annual report
Please find page 77 of the 2010 Chrysler annual report below. You can navigate through the pages in the report by either clicking on the pages listed below, or by using the keyword search tool below to find specific information within the annual report.-
 1
1 -
2
-
3
-
4
-
5
-
6
-
7
-
8
-
9
-
10
-
11
-
12
-
13
-
14
-
15
-
16
-
17
-
18
-
19
-
20
-
21
-
22
-
23
-
24
-
25
-
26
-
27
-
28
-
29
-
30
-
31
-
32
-
33
-
34
-
35
-
36
-
37
-
38
-
39
-
40
-
41
-
42
-
43
-
44
-
45
-
46
-
47
-
48
-
49
-
50
-
51
-
52
-
53
-
54
-
55
-
56
-
57
-
58
-
59
-
60
-
61
-
62
-
63
-
64
-
65
-
66
-
 67
67 -
 68
68 -
 69
69 -
 70
70 -
 71
71 -
 72
72 -
 73
73 -
 74
74 -
 75
75 -
 76
76 -
 77
77 -
 78
78 -
 79
79 -
 80
80 -
 81
81 -
 82
82 -
 83
83 -
 84
84 -
 85
85 -
 86
86 -
 87
87 -
88
-
89
-
90
-
91
-
92
-
93
-
94
-
95
-
96
-
97
-
98
-
99
-
100
-
101
-
102
-
103
-
104
-
105
-
106
-
107
-
108
-
109
-
110
-
111
-
112
-
113
-
114
-
115
-
116
-
117
-
118
-
119
-
120
-
121
-
122
-
123
-
124
-
125
-
126
-
127
-
128
-
129
-
130
-
131
-
132
-
133
-
134
-
135
-
136
-
137
-
138
-
139
-
140
-
141
-
142
-
143
-
144
-
145
-
146
-
147
-
148
-
149
-
150
-
151
-
152
-
153
-
154
-
155
-
156
-
157
-
158
-
159
-
160
-
161
-
162
-
163
-
164
-
165
-
166
-
167
-
168
-
169
-
170
-
171
-
172
-
173
-
174
-
175
-
176
-
177
-
178
-
179
-
180
-
181
-
182
-
183
-
184
-
185
-
186
-
187
-
188
-
189
-
190
-
191
-
192
-
193
-
194
-
195
-
196
-
197
-
198
-
199
-
200
-
201
-
202
-
203
-
204
-
205
-
206
-
207
-
208
-
209
-
210
-
211
-
212
-
213
-
214
-
215
-
216
-
217
-
218
-
219
-
220
-
221
-
222
-
223
-
224
-
225
-
226
-
227
-
228
-
229
-
230
-
231
-
232
-
233
-
234
-
235
-
236
-
237
-
238
-
239
-
240
-
241
-
242
-
243
-
244
-
245
-
246
-
247
-
248
-
249
-
250
-
251
-
252
-
253
-
254
-
255
-
256
-
257
-
258
-
259
-
260
-
261
-
262
-
263
-
264
-
265
-
266
-
267
-
268
-
269
-
270
-
271
-
272
-
273
-
274
-
275
-
276
-
277
-
278
-
279
-
280
-
281
-
282
-
283
-
284
-
285
-
286
-
287
-
288
-
289
-
290
-
291
-
292
-
293
-
294
-
295
-
296
-
297
-
298
-
299
-
300
-
301
-
302
-
303
-
304
-
305
-
306
-
307
-
308
-
309
-
310
-
311
-
312
-
313
-
314
-
315
-
316
-
317
-
318
-
319
-
320
-
321
-
322
-
323
-
324
-
325
-
326
-
327
-
328
-
329
-
330
-
331
-
332
-
333
-
334
-
335
-
336
-
337
-
338
-
339
-
340
-
341
-
342
-
343
-
344
-
345
-
346
-
347
-
348
-
349
-
350
-
351
-
352
-
353
-
354
-
355
-
356
-
357
-
358
-
359
-
360
-
361
-
362
-
363
-
364
-
365
-
366
-
367
-
368
-
369
-
370
-
371
-
372
-
373
-
374
-
375
-
376
-
377
-
378
-
379
-
380
-
381
-
382
-
383
-
384
-
385
-
386
-
387
-
388
-
389
-
390
-
391
-
392
-
393
-
394
-
395
-
396
-
397
-
398
-
399
-
400
-
401
-
402
 |
 |

REPORT ON
OPERATIONS
FINANCIAL
REVIEW –
FIAT GROUP
76
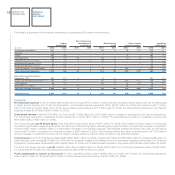
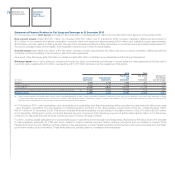
Industrial Activities and Financial Services: results for 2010
The following tables provide a breakdown of the consolidated statements of income, financial position and cash flows between Industrial Activities
and Financial Services. For Financial Services, Continuing Operations include the retail and dealer finance, leasing and rental activities for Fiat Group
Automobiles and Ferrari and Discontinued Operations include the financial services companies of CNH-Case New Holland and Iveco.
For both Continuing and Discontinued Operations, Financial Services also includes entities accounted for under the equity method, which are, respectively,
FGA Capital (the joint venture between Fiat Group Automobiles and Crédit Agricole) and Iveco Finance Holdings Limited (the joint venture between Iveco
and Barclays).
Basis of analysis
The segmentation between Industrial Activities and Financial Services represents a sub-consolidation prepared on the basis of the core business activities
carried out by each Group company.
Investments held by companies belonging to one segment in companies included in another segment are accounted for using the equity method. To avoid
a misleading presentation of net profit, the results of investments accounted for in this manner are classified in the income statement under Result from
intersegment investments.
The holding companies (Fiat S.p.A., Fiat Partecipazioni S.p.A. for Continuing Operations, and Fiat Industrial S.p.A. and Fiat Netherlands Holding N.V. for
Discontinued Operations) are included under Industrial Activities.
The sub-consolidation of Industrial Activities also includes companies that perform centralized treasury activities (i.e., raising funding in the market and
financing Group companies). These activities do not, however, include offering financing to third parties.
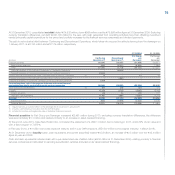
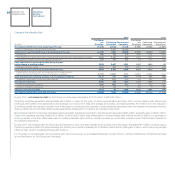
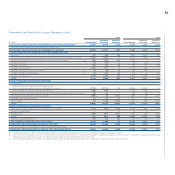
Operating Performance by Activity
Fiat Group pre Demerger
2010 2009
Industrial Financial Industrial Financial
(€ million)
Consolidated Activities Services Consolidated Activities Services
Net revenues 56,258 54,969 1,649 50,102 48,917 1,467
Cost of sales 47,738 46,798 1,300 43,261 42,404 1,139
Selling, general and administrative 4,742 4,572 170 4,296 4,133 163
Research and development 1,431 1,431 - 1,398 1,398 -
Other income/(expense) (143) (152) 9 (89) (92) 3
TRADING PROFIT/(LOSS) 2,204 2,016 188 1,058 890 168
Gains/(losses) on disposal of investments 15 15 - 4 4 -
Restructuring costs 176 176 - 312 310 2
Other unusual income/(expense) (34) (34) - (391) (412) 21
OPERATING PROFIT/(LOSS) 2,009 1,821 188 359 172 187
Financial income/(expense) (905) (905) - (753) (753) -
Result from investments (*) 178 117 61 27 (6) 33
PROFIT/(LOSS) BEFORE TAXES 1,282 1,033 249 (367) (587) 220
Income taxes 682 610 72 481 435 46
PROFIT/(LOSS) 600 423 177 (848) (1,022) 174
Result from intersegment investments - 177 5 - 174 (16)
PROFIT/(LOSS) 600 600 182 (848) (848) 158
(*) This item includes income from investments as well as impairment (losses)/reversals on non-intersegment investments accounted for under the equity method