Chrysler 2010 Annual Report Download - page 200
Download and view the complete annual report
Please find page 200 of the 2010 Chrysler annual report below. You can navigate through the pages in the report by either clicking on the pages listed below, or by using the keyword search tool below to find specific information within the annual report.-
 1
1 -
2
-
3
-
4
-
5
-
6
-
7
-
8
-
9
-
10
-
11
-
12
-
13
-
14
-
15
-
16
-
17
-
18
-
19
-
20
-
21
-
22
-
23
-
24
-
25
-
26
-
27
-
28
-
29
-
30
-
31
-
32
-
33
-
34
-
35
-
36
-
37
-
38
-
39
-
40
-
41
-
42
-
43
-
44
-
45
-
46
-
47
-
48
-
49
-
50
-
51
-
52
-
53
-
54
-
55
-
56
-
57
-
58
-
59
-
60
-
61
-
62
-
63
-
64
-
65
-
66
-
67
-
68
-
69
-
70
-
71
-
72
-
73
-
74
-
75
-
76
-
77
-
78
-
79
-
80
-
81
-
82
-
83
-
84
-
85
-
86
-
87
-
88
-
89
-
90
-
91
-
92
-
93
-
94
-
95
-
96
-
97
-
98
-
99
-
100
-
101
-
102
-
103
-
104
-
105
-
106
-
107
-
108
-
109
-
110
-
111
-
112
-
113
-
114
-
115
-
116
-
117
-
118
-
119
-
120
-
121
-
122
-
123
-
124
-
125
-
126
-
127
-
128
-
129
-
130
-
131
-
132
-
133
-
134
-
135
-
136
-
137
-
138
-
139
-
140
-
141
-
142
-
143
-
144
-
145
-
146
-
147
-
148
-
149
-
150
-
151
-
152
-
153
-
154
-
155
-
156
-
157
-
158
-
159
-
160
-
161
-
162
-
163
-
164
-
165
-
166
-
167
-
168
-
169
-
170
-
171
-
172
-
173
-
174
-
175
-
176
-
177
-
178
-
179
-
180
-
181
-
182
-
183
-
184
-
185
-
186
-
187
-
188
-
189
-
 190
190 -
 191
191 -
 192
192 -
 193
193 -
 194
194 -
 195
195 -
 196
196 -
 197
197 -
 198
198 -
 199
199 -
 200
200 -
 201
201 -
 202
202 -
 203
203 -
 204
204 -
 205
205 -
 206
206 -
 207
207 -
 208
208 -
 209
209 -
 210
210 -
211
-
212
-
213
-
214
-
215
-
216
-
217
-
218
-
219
-
220
-
221
-
222
-
223
-
224
-
225
-
226
-
227
-
228
-
229
-
230
-
231
-
232
-
233
-
234
-
235
-
236
-
237
-
238
-
239
-
240
-
241
-
242
-
243
-
244
-
245
-
246
-
247
-
248
-
249
-
250
-
251
-
252
-
253
-
254
-
255
-
256
-
257
-
258
-
259
-
260
-
261
-
262
-
263
-
264
-
265
-
266
-
267
-
268
-
269
-
270
-
271
-
272
-
273
-
274
-
275
-
276
-
277
-
278
-
279
-
280
-
281
-
282
-
283
-
284
-
285
-
286
-
287
-
288
-
289
-
290
-
291
-
292
-
293
-
294
-
295
-
296
-
297
-
298
-
299
-
300
-
301
-
302
-
303
-
304
-
305
-
306
-
307
-
308
-
309
-
310
-
311
-
312
-
313
-
314
-
315
-
316
-
317
-
318
-
319
-
320
-
321
-
322
-
323
-
324
-
325
-
326
-
327
-
328
-
329
-
330
-
331
-
332
-
333
-
334
-
335
-
336
-
337
-
338
-
339
-
340
-
341
-
342
-
343
-
344
-
345
-
346
-
347
-
348
-
349
-
350
-
351
-
352
-
353
-
354
-
355
-
356
-
357
-
358
-
359
-
360
-
361
-
362
-
363
-
364
-
365
-
366
-
367
-
368
-
369
-
370
-
371
-
372
-
373
-
374
-
375
-
376
-
377
-
378
-
379
-
380
-
381
-
382
-
383
-
384
-
385
-
386
-
387
-
388
-
389
-
390
-
391
-
392
-
393
-
394
-
395
-
396
-
397
-
398
-
399
-
400
-
401
-
402
 |
 |

199
In 2010 the column Disposals and other changes, showing a reduction of €126 million, consists of a decrease of €94 million as the result of the distribution
of dividends by companies accounted for using the equity method, of which €26 million received by FGA Capital; the negative fair value adjustment of
€4 million relating to the investment classified as available-for-sale; the positive changes of €5 million in the cash flow hedge reserve of Tofas-Turk Otomobil
Fabrikasi Tofas A.S., of €3 million in the cash flow hedge reserve of FGA Capital and other minor decreases of €36 million.
In 2009 Disposals and other changes, a reduction of €68 million, consisted of a decrease of €53 million as the result of the distribution of dividends by
companies accounted for using the equity method; the positive fair value adjustment of €3 million relating to investment classified as available-for-sale and
other minor decreases of €18 million.
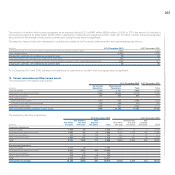
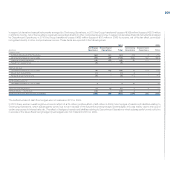
The item Investments in jointly controlled entities comprises the following:
At 31 December 2010 At 31 December 2009
% of interest (€ million) % of interest (€ million)
Continuing Operations
FGA Capital S.p.A. 50.0 700 50.0 643
Tofas-Turk Otomobil Fabrikasi Tofas A.S. 37.9 304 37.9 241
Société Européenne de Véhicules Légers du Nord-Sevelnord Société Anonyme 50.0 99 50.0 95
Società Europea Veicoli Leggeri-Sevel S.p.A. 50.0 95 50.0 105
GAC Fiat Automobiles Co. Ltd. 50.0 50 - -
Fiat India Automobiles Private Limited 50.0 42 50.0 21
Naveco (Nanjing Iveco Motor Co.) Ltd. - - 50.0 137
Turk Traktor Ve Ziraat Makineleri A.S. - - 37.5 49
SAIC Iveco Commercial Vehicle Investment Company Limited - - 50.0 43
New Holland HFT Japan Inc. - - 50.0 23
LBX Company LLC - - 50.0 16
CNH de Mexico SA de CV - - 50.0 16
Transolver Finance Establecimiento Financiero de Credito S.A. - - 50.0 8
Other 33 34
Total Continuing Operations 1,323 1,431
Discontinued Operations
Naveco (Nanjing Iveco Motor Co.) Ltd. 50.0 150 - -
Turk Traktor Ve Ziraat Makineleri A.S. 37.5 79 - -
SAIC Iveco Commercial Vehicle Investment Company Limited 50.0 45 - -
New Holland HFT Japan Inc. 50.0 33 - -
CNH de Mexico SA de CV 50.0 21 - -
Transolver Finance Establecimiento Financiero de Credito S.A. 50.0 5 - -
Other 5 - -
Total Discontinued Operations 338 -
Total Investments in jointly controlled entities 1,661 1,431