Chrysler 2010 Annual Report Download - page 246
Download and view the complete annual report
Please find page 246 of the 2010 Chrysler annual report below. You can navigate through the pages in the report by either clicking on the pages listed below, or by using the keyword search tool below to find specific information within the annual report.-
 1
1 -
2
-
3
-
4
-
5
-
6
-
7
-
8
-
9
-
10
-
11
-
12
-
13
-
14
-
15
-
16
-
17
-
18
-
19
-
20
-
21
-
22
-
23
-
24
-
25
-
26
-
27
-
28
-
29
-
30
-
31
-
32
-
33
-
34
-
35
-
36
-
37
-
38
-
39
-
40
-
41
-
42
-
43
-
44
-
45
-
46
-
47
-
48
-
49
-
50
-
51
-
52
-
53
-
54
-
55
-
56
-
57
-
58
-
59
-
60
-
61
-
62
-
63
-
64
-
65
-
66
-
67
-
68
-
69
-
70
-
71
-
72
-
73
-
74
-
75
-
76
-
77
-
78
-
79
-
80
-
81
-
82
-
83
-
84
-
85
-
86
-
87
-
88
-
89
-
90
-
91
-
92
-
93
-
94
-
95
-
96
-
97
-
98
-
99
-
100
-
101
-
102
-
103
-
104
-
105
-
106
-
107
-
108
-
109
-
110
-
111
-
112
-
113
-
114
-
115
-
116
-
117
-
118
-
119
-
120
-
121
-
122
-
123
-
124
-
125
-
126
-
127
-
128
-
129
-
130
-
131
-
132
-
133
-
134
-
135
-
136
-
137
-
138
-
139
-
140
-
141
-
142
-
143
-
144
-
145
-
146
-
147
-
148
-
149
-
150
-
151
-
152
-
153
-
154
-
155
-
156
-
157
-
158
-
159
-
160
-
161
-
162
-
163
-
164
-
165
-
166
-
167
-
168
-
169
-
170
-
171
-
172
-
173
-
174
-
175
-
176
-
177
-
178
-
179
-
180
-
181
-
182
-
183
-
184
-
185
-
186
-
187
-
188
-
189
-
190
-
191
-
192
-
193
-
194
-
195
-
196
-
197
-
198
-
199
-
200
-
201
-
202
-
203
-
204
-
205
-
206
-
207
-
208
-
209
-
210
-
211
-
212
-
213
-
214
-
215
-
216
-
217
-
218
-
219
-
220
-
221
-
222
-
223
-
224
-
225
-
226
-
227
-
228
-
229
-
230
-
231
-
232
-
233
-
234
-
235
-
 236
236 -
 237
237 -
 238
238 -
 239
239 -
 240
240 -
 241
241 -
 242
242 -
 243
243 -
 244
244 -
 245
245 -
 246
246 -
 247
247 -
 248
248 -
 249
249 -
 250
250 -
 251
251 -
 252
252 -
 253
253 -
 254
254 -
 255
255 -
 256
256 -
257
-
258
-
259
-
260
-
261
-
262
-
263
-
264
-
265
-
266
-
267
-
268
-
269
-
270
-
271
-
272
-
273
-
274
-
275
-
276
-
277
-
278
-
279
-
280
-
281
-
282
-
283
-
284
-
285
-
286
-
287
-
288
-
289
-
290
-
291
-
292
-
293
-
294
-
295
-
296
-
297
-
298
-
299
-
300
-
301
-
302
-
303
-
304
-
305
-
306
-
307
-
308
-
309
-
310
-
311
-
312
-
313
-
314
-
315
-
316
-
317
-
318
-
319
-
320
-
321
-
322
-
323
-
324
-
325
-
326
-
327
-
328
-
329
-
330
-
331
-
332
-
333
-
334
-
335
-
336
-
337
-
338
-
339
-
340
-
341
-
342
-
343
-
344
-
345
-
346
-
347
-
348
-
349
-
350
-
351
-
352
-
353
-
354
-
355
-
356
-
357
-
358
-
359
-
360
-
361
-
362
-
363
-
364
-
365
-
366
-
367
-
368
-
369
-
370
-
371
-
372
-
373
-
374
-
375
-
376
-
377
-
378
-
379
-
380
-
381
-
382
-
383
-
384
-
385
-
386
-
387
-
388
-
389
-
390
-
391
-
392
-
393
-
394
-
395
-
396
-
397
-
398
-
399
-
400
-
401
-
402
 |
 |

245
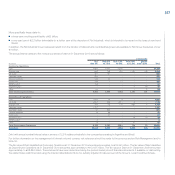
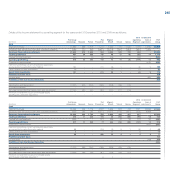
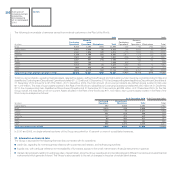
Details of the income statement by operating segment for the years ended 31 December 2010 and 2009 are as follows:
Other Unallocated
Fiat Group Fiat Magneti Operating items & FIAT
(€ million) Automobiles Maserati Ferrari Powertrain Marelli Teksid Comau Segments adjustments Group
2010
Segment revenues 27,860 586 1,919 4,211 5,402 776 1,023 1,159 (7,056) 35,880
Revenues from transactions with other operating segments (238) (72) (65) (3,627) (2,079) (204) (280) (491) 7.056 -
Revenues from external customers 27,622 514 1,854 584 3.323 572 743 668 - 35,880
Trading profit/(loss) 607 24 303 140 98 17 (6) (85) 14 1,112
Unusual income/(expense) (92) - (1) 32 (25) - - (34) - (120)
Operating profit/(loss) 515 24 302 172 73 17 (6) (119) 14 992
Financial income/(expense) (400) (400)
Interest in profit/(loss) of joint ventures and associates
accounted for by using the equity method 134 - - (11) (3) 1 - (3) 2 120
Other profit/(loss) from investments (3) - - - (2) - - (1) - (6)
Result from investments 131 - - (11) (5) 1 - (4) 2 114
Profit/(loss) before taxes 706
Income taxes 484 484
Profit/(loss) from Continuing Operations 222
Amortisation and depreciation (1,197) (81) (251) (259) (293) (28) (13)
Goodwill impairment - - - - - - -
Non-cash items other than depreciation and amortisation (1,702) (40) (52) (83) (137) (17) (16)
Reversal of impairment losses on Intangible assets
and Property, plant and equipment - - - - - - -
Other Unallocated
Fiat Group Fiat Magneti Operating items & FIAT
(€ million) Automobiles Maserati Ferrari Powertrain Marelli Teksid Comau Segments adjustments Group
2009
Segment revenues 26,293 448 1,778 3,372 4,528 578 728 1,047 (6,088) 32,684
Revenues from transactions with other operating segments (203) (48) (46) (3,077) (1,874) (173) (247) (420) 6,088 -
Revenues from external customers 26,090 400 1,732 295 2.654 405 481 627 - 32,684
Trading profit/(loss) 470 11 238 104 25 (12) (28) (90) 18 736
Unusual income/(expense) (253) - 7 (27) (65) (2) (4) (11) (3) (358)
Operating profit/(loss) 217 11 245 77 (40) (14) (32) (101) 15 378
Financial income/(expense) (352) (352)
Interest in profit/(loss) of joint ventures and associates
accounted for by using the equity method 88 - - (24) (2) 3 1 (3) 2 65
Other profit/(loss) from investments 8 - - - (1) - - 5 - 12
Result from investments 96 - - (24) (3) 3 1 2 2 77
Profit/(loss) before taxes 103
Income taxes 448 448
Profit/(loss) from Continuing Operations (345)
Amortisation and depreciation (1,224) (59) (194) (195) (263) (25) (15)
Goodwill impairment - - - - - - -
Non-cash items other than depreciation and amortisation (1,543) (36) (43) (87) (126) (26) (20)
Reversal of impairment losses on Intangible assets
and Property, plant and equipment - - - 6 2 - -