Chrysler 2010 Annual Report Download - page 76
Download and view the complete annual report
Please find page 76 of the 2010 Chrysler annual report below. You can navigate through the pages in the report by either clicking on the pages listed below, or by using the keyword search tool below to find specific information within the annual report.-
 1
1 -
2
-
3
-
4
-
5
-
6
-
7
-
8
-
9
-
10
-
11
-
12
-
13
-
14
-
15
-
16
-
17
-
18
-
19
-
20
-
21
-
22
-
23
-
24
-
25
-
26
-
27
-
28
-
29
-
30
-
31
-
32
-
33
-
34
-
35
-
36
-
37
-
38
-
39
-
40
-
41
-
42
-
43
-
44
-
45
-
46
-
47
-
48
-
49
-
50
-
51
-
52
-
53
-
54
-
55
-
56
-
57
-
58
-
59
-
60
-
61
-
62
-
63
-
64
-
65
-
 66
66 -
 67
67 -
 68
68 -
 69
69 -
 70
70 -
 71
71 -
 72
72 -
 73
73 -
 74
74 -
 75
75 -
 76
76 -
 77
77 -
 78
78 -
 79
79 -
 80
80 -
 81
81 -
 82
82 -
 83
83 -
 84
84 -
 85
85 -
 86
86 -
87
-
88
-
89
-
90
-
91
-
92
-
93
-
94
-
95
-
96
-
97
-
98
-
99
-
100
-
101
-
102
-
103
-
104
-
105
-
106
-
107
-
108
-
109
-
110
-
111
-
112
-
113
-
114
-
115
-
116
-
117
-
118
-
119
-
120
-
121
-
122
-
123
-
124
-
125
-
126
-
127
-
128
-
129
-
130
-
131
-
132
-
133
-
134
-
135
-
136
-
137
-
138
-
139
-
140
-
141
-
142
-
143
-
144
-
145
-
146
-
147
-
148
-
149
-
150
-
151
-
152
-
153
-
154
-
155
-
156
-
157
-
158
-
159
-
160
-
161
-
162
-
163
-
164
-
165
-
166
-
167
-
168
-
169
-
170
-
171
-
172
-
173
-
174
-
175
-
176
-
177
-
178
-
179
-
180
-
181
-
182
-
183
-
184
-
185
-
186
-
187
-
188
-
189
-
190
-
191
-
192
-
193
-
194
-
195
-
196
-
197
-
198
-
199
-
200
-
201
-
202
-
203
-
204
-
205
-
206
-
207
-
208
-
209
-
210
-
211
-
212
-
213
-
214
-
215
-
216
-
217
-
218
-
219
-
220
-
221
-
222
-
223
-
224
-
225
-
226
-
227
-
228
-
229
-
230
-
231
-
232
-
233
-
234
-
235
-
236
-
237
-
238
-
239
-
240
-
241
-
242
-
243
-
244
-
245
-
246
-
247
-
248
-
249
-
250
-
251
-
252
-
253
-
254
-
255
-
256
-
257
-
258
-
259
-
260
-
261
-
262
-
263
-
264
-
265
-
266
-
267
-
268
-
269
-
270
-
271
-
272
-
273
-
274
-
275
-
276
-
277
-
278
-
279
-
280
-
281
-
282
-
283
-
284
-
285
-
286
-
287
-
288
-
289
-
290
-
291
-
292
-
293
-
294
-
295
-
296
-
297
-
298
-
299
-
300
-
301
-
302
-
303
-
304
-
305
-
306
-
307
-
308
-
309
-
310
-
311
-
312
-
313
-
314
-
315
-
316
-
317
-
318
-
319
-
320
-
321
-
322
-
323
-
324
-
325
-
326
-
327
-
328
-
329
-
330
-
331
-
332
-
333
-
334
-
335
-
336
-
337
-
338
-
339
-
340
-
341
-
342
-
343
-
344
-
345
-
346
-
347
-
348
-
349
-
350
-
351
-
352
-
353
-
354
-
355
-
356
-
357
-
358
-
359
-
360
-
361
-
362
-
363
-
364
-
365
-
366
-
367
-
368
-
369
-
370
-
371
-
372
-
373
-
374
-
375
-
376
-
377
-
378
-
379
-
380
-
381
-
382
-
383
-
384
-
385
-
386
-
387
-
388
-
389
-
390
-
391
-
392
-
393
-
394
-
395
-
396
-
397
-
398
-
399
-
400
-
401
-
402
 |
 |

75
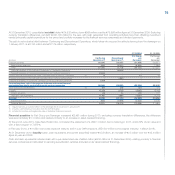
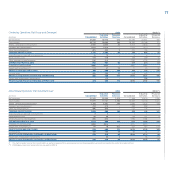
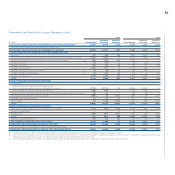
At 31 December 2010, consolidated net debt totaled €14,932 million, down €966 million over the €15,898 million figure at 31 December 2009. Excluding
currency translation differences, net debt fell €1,790 million for the year, with cash generated from operating activities more than offsetting investment
needs (principally capital expenditure for the period and portfolio increases for the financial services companies) and dividend payments.
The split in net industrial debt between Continuing and Discontinued Operations, which takes into account the effects deriving from the demerger on
1 January 2011, is €2,753 million and €12,179 million, respectively.
31.12.2010 31.12.2009
Fiat Group Fiat Group
Continuing Discontinued pre pre
(€ million) Operations (*) Operations (*) Demerger Demerger
Financial payables (20,804) (18,695) (31,008) (28,527)
Asset-backed financing (533) (8,321) (8,854) (7,086)
Other (17,406) (4,748) (22,154) (21,441)
Financial payables of Discontinued Operations to Continuing Operations - (5,626) -
Financial payables of Continuing Operations to Discontinued Operations (2,865) - -
Current financial receivables from jointly-controlled financial services companies (1) 12 - 12 14
Financial receivables of Discontinued Operations from Continuing Operations - 2,865 -
Financial receivables of Continuing Operations from Discontinued Operations 5,626 - -
Financial payables, net of intersegment balances and current financial
receivables from jointly-controlled financial services companies (15,166) (15,830) (30,996) (28,513)
Other financial assets/(liabilities) (2) 261 (59) 202 172
Liquidity 12,152 3,710 15,862 12,443
Current securities 185 24 209 217
Cash and cash equivalents 11,967 3,686 15,653 12,226
Net Debt (2,753) (12,179) (14,932) (15,898)
Industrial Activities (542) (1,900) (2,442) (4,418)
Financial Services (2,211) (10,279) (12,490) (11,480)
(*) Figures take into account the effects of the demerger which occurred on 1 January 2011
(1) Includes current financial receivables from the JV FGA Capital
(2) Includes the positive and negative fair value of derivative financial instruments
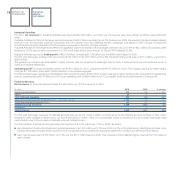
Financial payables for Fiat Group pre Demerger increased €2,481 million during 2010, excluding currency translation differences, the difference
was approximately €1.1 billion and related primarily to an increase in asset-backed financing.
At the end of June 2010, Case New Holland Inc. completed the placement of a USD 1.5 billion bond, maturing in 2017, at 99.32% of par value and
with a fixed coupon of 7.875%.
In February 2010, a €1 billion bond was repaid at maturity and in July CNH prepaid a USD 500 million bond (original maturity: 1 March 2014).
At 31 December 2010, liquidity (cash, cash equivalents and current securities) totaled €15.9 billion, an increase of €3.5 billion over the €12.4 billion
figure at year-end 2009.
Cash and cash equivalents included cash with a pre-determined use of €694 million (€530 million at 31 December 2009), relating primarily to financial
services companies and allocated to servicing securitization vehicles (included under asset-backed financing).