Chrysler 2010 Annual Report Download - page 195
Download and view the complete annual report
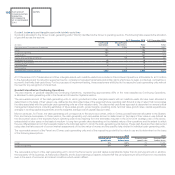
Please find page 195 of the 2010 Chrysler annual report below. You can navigate through the pages in the report by either clicking on the pages listed below, or by using the keyword search tool below to find specific information within the annual report.-
 1
1 -
2
-
3
-
4
-
5
-
6
-
7
-
8
-
9
-
10
-
11
-
12
-
13
-
14
-
15
-
16
-
17
-
18
-
19
-
20
-
21
-
22
-
23
-
24
-
25
-
26
-
27
-
28
-
29
-
30
-
31
-
32
-
33
-
34
-
35
-
36
-
37
-
38
-
39
-
40
-
41
-
42
-
43
-
44
-
45
-
46
-
47
-
48
-
49
-
50
-
51
-
52
-
53
-
54
-
55
-
56
-
57
-
58
-
59
-
60
-
61
-
62
-
63
-
64
-
65
-
66
-
67
-
68
-
69
-
70
-
71
-
72
-
73
-
74
-
75
-
76
-
77
-
78
-
79
-
80
-
81
-
82
-
83
-
84
-
85
-
86
-
87
-
88
-
89
-
90
-
91
-
92
-
93
-
94
-
95
-
96
-
97
-
98
-
99
-
100
-
101
-
102
-
103
-
104
-
105
-
106
-
107
-
108
-
109
-
110
-
111
-
112
-
113
-
114
-
115
-
116
-
117
-
118
-
119
-
120
-
121
-
122
-
123
-
124
-
125
-
126
-
127
-
128
-
129
-
130
-
131
-
132
-
133
-
134
-
135
-
136
-
137
-
138
-
139
-
140
-
141
-
142
-
143
-
144
-
145
-
146
-
147
-
148
-
149
-
150
-
151
-
152
-
153
-
154
-
155
-
156
-
157
-
158
-
159
-
160
-
161
-
162
-
163
-
164
-
165
-
166
-
167
-
168
-
169
-
170
-
171
-
172
-
173
-
174
-
175
-
176
-
177
-
178
-
179
-
180
-
181
-
182
-
183
-
184
-
 185
185 -
 186
186 -
 187
187 -
 188
188 -
 189
189 -
 190
190 -
 191
191 -
 192
192 -
 193
193 -
 194
194 -
 195
195 -
 196
196 -
 197
197 -
 198
198 -
 199
199 -
 200
200 -
 201
201 -
 202
202 -
 203
203 -
 204
204 -
 205
205 -
206
-
207
-
208
-
209
-
210
-
211
-
212
-
213
-
214
-
215
-
216
-
217
-
218
-
219
-
220
-
221
-
222
-
223
-
224
-
225
-
226
-
227
-
228
-
229
-
230
-
231
-
232
-
233
-
234
-
235
-
236
-
237
-
238
-
239
-
240
-
241
-
242
-
243
-
244
-
245
-
246
-
247
-
248
-
249
-
250
-
251
-
252
-
253
-
254
-
255
-
256
-
257
-
258
-
259
-
260
-
261
-
262
-
263
-
264
-
265
-
266
-
267
-
268
-
269
-
270
-
271
-
272
-
273
-
274
-
275
-
276
-
277
-
278
-
279
-
280
-
281
-
282
-
283
-
284
-
285
-
286
-
287
-
288
-
289
-
290
-
291
-
292
-
293
-
294
-
295
-
296
-
297
-
298
-
299
-
300
-
301
-
302
-
303
-
304
-
305
-
306
-
307
-
308
-
309
-
310
-
311
-
312
-
313
-
314
-
315
-
316
-
317
-
318
-
319
-
320
-
321
-
322
-
323
-
324
-
325
-
326
-
327
-
328
-
329
-
330
-
331
-
332
-
333
-
334
-
335
-
336
-
337
-
338
-
339
-
340
-
341
-
342
-
343
-
344
-
345
-
346
-
347
-
348
-
349
-
350
-
351
-
352
-
353
-
354
-
355
-
356
-
357
-
358
-
359
-
360
-
361
-
362
-
363
-
364
-
365
-
366
-
367
-
368
-
369
-
370
-
371
-
372
-
373
-
374
-
375
-
376
-
377
-
378
-
379
-
380
-
381
-
382
-
383
-
384
-
385
-
386
-
387
-
388
-
389
-
390
-
391
-
392
-
393
-
394
-
395
-
396
-
397
-
398
-
399
-
400
-
401
-
402
 |
 |

FIAT GROUP
CONSOLIDATED
FINANCIAL
STATEMENTS
AT 31 DECEMBER
2010
NOTES
194
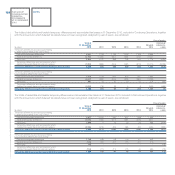
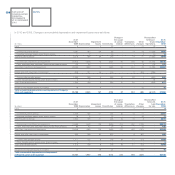
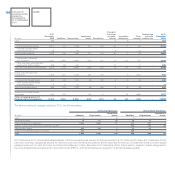
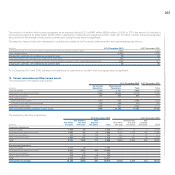
In 2010 and 2009, Changes in accumulated depreciation and impairment losses were as follows:
Change in Reclassified
At 31 the scope to Discon- At 31
December Impairment of conso- Translation Other tinued December
(€ million) 2009 Depreciation losses Divestitures lidation differences changes Operations 2010
Land 9 - 2 (2) - 1 (1) (2) 7
Owned industrial buildings 2,561 182 59 (9) 7 74 15 (1,053) 1,836
Industrial buildings leased under finance leases 17 2 - (1) - - 2 (7) 13
Total Industrial buildings 2,578 184 59 (10) 7 74 17 (1,060) 1,849
Owned plant, machinery and equipment 20,813 1,548 73 (542) 92 400 (8) (4,226) 18,150
Plant, machinery and equipment leased under finance leases 120 44 - - - 1 5 (13) 157
Total Plant, machinery and equipment 20,933 1,592 73 (542) 92 401 (3) (4,239) 18,307
Assets sold with a buy-back commitment 308 131 26 (76) - 2 (95) (296) -
Owned other tangible assets 1,339 135 3 (99) (2) 32 1 (541) 868
Other tangible assets leased under finance leases 5 1 - - - - - (3) 3
Total Other tangible assets 1,344 136 3 (99) (2) 32 1 (544) 871
Advances and tangible assets in progress 16 - 4 - - - (2) - 18
Total accumulated depreciation and impairment of Property,
plant and equipment 25,188 2,043 167 (729) 97 510 (83) (6,141) 21,052
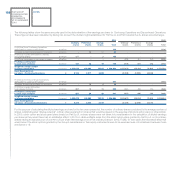
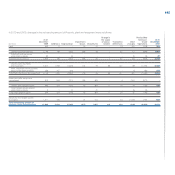
Change in Reclassified
At 31 the scope to Assets At 31
December Impairment of conso- Translation Other held December
(€ million) 2008 Depreciation losses Divestitures lidation differences changes for sale 2009
Land 6 - - - - 1 2 - 9
Owned industrial buildings 2,326 155 21 (22) (5) 75 11 - 2,561
Industrial buildings leased under finance leases 18 3 - (1) - - (3) - 17
Total Industrial buildings 2,344 158 21 (23) (5) 75 8 - 2,578
Owned plant, machinery and equipment 19,565 1,443 126 (645) (10) 462 (128) - 20,813
Plant, machinery and equipment leased under finance leases 83 42 - (1) (2) - (2) - 120
Total Plant, machinery and equipment 19,648 1,485 126 (646) (12) 462 (130) - 20,933
Assets sold with a buy-back commitment 300 135 32 (81) - 4 (82) - 308
Owned other tangible assets 1,271 125 8 (79) (3) 27 (10) - 1,339
Other tangible assets leased under finance leases 4 1 - - - - - - 5
Total Other tangible assets 1,275 126 8 (79) (3) 27 (10) - 1,344
Advances and tangible assets in progress 14 - 19 (2) - - (15) - 16
Total accumulated depreciation and impairment
of Property, plant and equipment 23,587 1,904 206 (831) (20) 569 (227) - 25,188