Chrysler 2010 Annual Report Download - page 146
Download and view the complete annual report
Please find page 146 of the 2010 Chrysler annual report below. You can navigate through the pages in the report by either clicking on the pages listed below, or by using the keyword search tool below to find specific information within the annual report.-
 1
1 -
2
-
3
-
4
-
5
-
6
-
7
-
8
-
9
-
10
-
11
-
12
-
13
-
14
-
15
-
16
-
17
-
18
-
19
-
20
-
21
-
22
-
23
-
24
-
25
-
26
-
27
-
28
-
29
-
30
-
31
-
32
-
33
-
34
-
35
-
36
-
37
-
38
-
39
-
40
-
41
-
42
-
43
-
44
-
45
-
46
-
47
-
48
-
49
-
50
-
51
-
52
-
53
-
54
-
55
-
56
-
57
-
58
-
59
-
60
-
61
-
62
-
63
-
64
-
65
-
66
-
67
-
68
-
69
-
70
-
71
-
72
-
73
-
74
-
75
-
76
-
77
-
78
-
79
-
80
-
81
-
82
-
83
-
84
-
85
-
86
-
87
-
88
-
89
-
90
-
91
-
92
-
93
-
94
-
95
-
96
-
97
-
98
-
99
-
100
-
101
-
102
-
103
-
104
-
105
-
106
-
107
-
108
-
109
-
110
-
111
-
112
-
113
-
114
-
115
-
116
-
117
-
118
-
119
-
120
-
121
-
122
-
123
-
124
-
125
-
126
-
127
-
128
-
129
-
130
-
131
-
132
-
133
-
134
-
135
-
 136
136 -
 137
137 -
 138
138 -
 139
139 -
 140
140 -
 141
141 -
 142
142 -
 143
143 -
 144
144 -
 145
145 -
 146
146 -
 147
147 -
 148
148 -
 149
149 -
 150
150 -
 151
151 -
 152
152 -
 153
153 -
 154
154 -
 155
155 -
 156
156 -
157
-
158
-
159
-
160
-
161
-
162
-
163
-
164
-
165
-
166
-
167
-
168
-
169
-
170
-
171
-
172
-
173
-
174
-
175
-
176
-
177
-
178
-
179
-
180
-
181
-
182
-
183
-
184
-
185
-
186
-
187
-
188
-
189
-
190
-
191
-
192
-
193
-
194
-
195
-
196
-
197
-
198
-
199
-
200
-
201
-
202
-
203
-
204
-
205
-
206
-
207
-
208
-
209
-
210
-
211
-
212
-
213
-
214
-
215
-
216
-
217
-
218
-
219
-
220
-
221
-
222
-
223
-
224
-
225
-
226
-
227
-
228
-
229
-
230
-
231
-
232
-
233
-
234
-
235
-
236
-
237
-
238
-
239
-
240
-
241
-
242
-
243
-
244
-
245
-
246
-
247
-
248
-
249
-
250
-
251
-
252
-
253
-
254
-
255
-
256
-
257
-
258
-
259
-
260
-
261
-
262
-
263
-
264
-
265
-
266
-
267
-
268
-
269
-
270
-
271
-
272
-
273
-
274
-
275
-
276
-
277
-
278
-
279
-
280
-
281
-
282
-
283
-
284
-
285
-
286
-
287
-
288
-
289
-
290
-
291
-
292
-
293
-
294
-
295
-
296
-
297
-
298
-
299
-
300
-
301
-
302
-
303
-
304
-
305
-
306
-
307
-
308
-
309
-
310
-
311
-
312
-
313
-
314
-
315
-
316
-
317
-
318
-
319
-
320
-
321
-
322
-
323
-
324
-
325
-
326
-
327
-
328
-
329
-
330
-
331
-
332
-
333
-
334
-
335
-
336
-
337
-
338
-
339
-
340
-
341
-
342
-
343
-
344
-
345
-
346
-
347
-
348
-
349
-
350
-
351
-
352
-
353
-
354
-
355
-
356
-
357
-
358
-
359
-
360
-
361
-
362
-
363
-
364
-
365
-
366
-
367
-
368
-
369
-
370
-
371
-
372
-
373
-
374
-
375
-
376
-
377
-
378
-
379
-
380
-
381
-
382
-
383
-
384
-
385
-
386
-
387
-
388
-
389
-
390
-
391
-
392
-
393
-
394
-
395
-
396
-
397
-
398
-
399
-
400
-
401
-
402
 |
 |
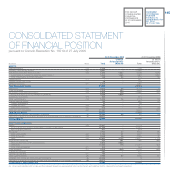
145
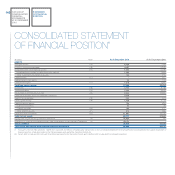
At 31 December 2010 At 31 December 2009
of which of which
Related parties Related parties
(€ million) Note Total (Note 34) Total (Note 34)
ASSETS
Intangible assets (14) 4,350 - 7,199 -
Property, plant and equipment (15) 9,601 - 12,945 -
Investments and other financial assets: (16) 1,653 1,557 2,159 1,979
Investments accounted for using the equity method 1,465 1,465 1,884 1,884
Other investments and financial assets 188 92 275 95
Leased assets (17) - - 457 -
Defined benefit plan assets 20 - 144 -
Deferred tax assets (11) 1,678 - 2,580 -
Total Non-current assets 17,302 25,484
Inventories (18) 4,443 28 8,748 10
Trade receivables (19) 2,259 459 3,649 595
Receivables from financing activities (19) 2,866 129 12,695 120
Financial receivables from Discontinued Operations 5,626 5.626 - -
Current tax receivables (19) 353 - 674 -
Other current assets (19) 1,528 76 2,778 65
Current financial assets: 735 - 899 52
Current investments 34 - 46 -
Current securities (20) 185 - 217 -
Other financial assets (21) 516 - 636 52
Cash and cash equivalents (22) 11,967 - 12,226 651
Total Current assets 29,777 41,669
Assets held for sale and Discontinued Operations (A) 34,854 65 82 59
Elimination of financial receivables and debt due from/payable to Discontinued Operations (A) (8,491) - - -
TOTAL ASSETS 73,442 67,235
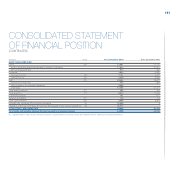
EQUITY AND LIABILITIES
Equity: (23) 12,461 - 11,115 -
Issued capital and reserves attributable to owners of the parent 11,544 - 10,301 -
Non-controlling interests 917 - 814 -
Provisions: 4,924 47 8,432 80
Employee benefits (24) 1,704 21 3,447 30
Other provisions (25) 3,220 26 4,985 50
Debt: (26) 20,804 3,144 28,527 1,144
Asset-backed financing 533 101 7,086 486
Debt payable to Discontinued Operations 2,865 2.865 - -
Other debt 17,406 178 21,441 658
Other financial liabilities (21) 255 - 464 49
Trade payables (27) 9,345 1,040 12,295 886
Current tax payables 181 - 377 -
Deferred tax liabilities (11) 135 - 152 -
Other current liabilities (28) 3,908 87 5,865 181
Liabilities held for sale and Discontinued Operations (A) 29,920 - 8 1
Elimination of financial receivables and debt due from/payable to Discontinued Operations (A) (8,491) - - -
TOTAL EQUITY AND LIABILITIES 73,442 67,235
(A) Assets and Liabilities held for sale and Discontinued Operations are presented in the section Assets and Liabilities held for sale and Discontinued Operations.
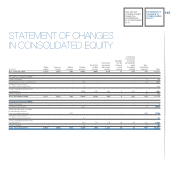
CONSOLIDATED STATEMENT
OF FINANCIAL POSITION
pursuant to Consob Resolution No. 15519 of 27 July 2006
FIAT GROUP
CONSOLIDATED
FINANCIAL
STATEMENTS
AT 31 DECEMBER
2010
STATEMENT
OF FINANCIAL
POSITION
PURSUANT TO
CONSOB RESOLUTION
NO. 15519
OF 27 JULY 2006