Chrysler 2010 Annual Report Download - page 100
Download and view the complete annual report
Please find page 100 of the 2010 Chrysler annual report below. You can navigate through the pages in the report by either clicking on the pages listed below, or by using the keyword search tool below to find specific information within the annual report.-
 1
1 -
2
-
3
-
4
-
5
-
6
-
7
-
8
-
9
-
10
-
11
-
12
-
13
-
14
-
15
-
16
-
17
-
18
-
19
-
20
-
21
-
22
-
23
-
24
-
25
-
26
-
27
-
28
-
29
-
30
-
31
-
32
-
33
-
34
-
35
-
36
-
37
-
38
-
39
-
40
-
41
-
42
-
43
-
44
-
45
-
46
-
47
-
48
-
49
-
50
-
51
-
52
-
53
-
54
-
55
-
56
-
57
-
58
-
59
-
60
-
61
-
62
-
63
-
64
-
65
-
66
-
67
-
68
-
69
-
70
-
71
-
72
-
73
-
74
-
75
-
76
-
77
-
78
-
79
-
80
-
81
-
82
-
83
-
84
-
85
-
86
-
87
-
88
-
89
-
 90
90 -
 91
91 -
 92
92 -
 93
93 -
 94
94 -
 95
95 -
 96
96 -
 97
97 -
 98
98 -
 99
99 -
 100
100 -
 101
101 -
 102
102 -
 103
103 -
 104
104 -
 105
105 -
 106
106 -
 107
107 -
 108
108 -
 109
109 -
 110
110 -
111
-
112
-
113
-
114
-
115
-
116
-
117
-
118
-
119
-
120
-
121
-
122
-
123
-
124
-
125
-
126
-
127
-
128
-
129
-
130
-
131
-
132
-
133
-
134
-
135
-
136
-
137
-
138
-
139
-
140
-
141
-
142
-
143
-
144
-
145
-
146
-
147
-
148
-
149
-
150
-
151
-
152
-
153
-
154
-
155
-
156
-
157
-
158
-
159
-
160
-
161
-
162
-
163
-
164
-
165
-
166
-
167
-
168
-
169
-
170
-
171
-
172
-
173
-
174
-
175
-
176
-
177
-
178
-
179
-
180
-
181
-
182
-
183
-
184
-
185
-
186
-
187
-
188
-
189
-
190
-
191
-
192
-
193
-
194
-
195
-
196
-
197
-
198
-
199
-
200
-
201
-
202
-
203
-
204
-
205
-
206
-
207
-
208
-
209
-
210
-
211
-
212
-
213
-
214
-
215
-
216
-
217
-
218
-
219
-
220
-
221
-
222
-
223
-
224
-
225
-
226
-
227
-
228
-
229
-
230
-
231
-
232
-
233
-
234
-
235
-
236
-
237
-
238
-
239
-
240
-
241
-
242
-
243
-
244
-
245
-
246
-
247
-
248
-
249
-
250
-
251
-
252
-
253
-
254
-
255
-
256
-
257
-
258
-
259
-
260
-
261
-
262
-
263
-
264
-
265
-
266
-
267
-
268
-
269
-
270
-
271
-
272
-
273
-
274
-
275
-
276
-
277
-
278
-
279
-
280
-
281
-
282
-
283
-
284
-
285
-
286
-
287
-
288
-
289
-
290
-
291
-
292
-
293
-
294
-
295
-
296
-
297
-
298
-
299
-
300
-
301
-
302
-
303
-
304
-
305
-
306
-
307
-
308
-
309
-
310
-
311
-
312
-
313
-
314
-
315
-
316
-
317
-
318
-
319
-
320
-
321
-
322
-
323
-
324
-
325
-
326
-
327
-
328
-
329
-
330
-
331
-
332
-
333
-
334
-
335
-
336
-
337
-
338
-
339
-
340
-
341
-
342
-
343
-
344
-
345
-
346
-
347
-
348
-
349
-
350
-
351
-
352
-
353
-
354
-
355
-
356
-
357
-
358
-
359
-
360
-
361
-
362
-
363
-
364
-
365
-
366
-
367
-
368
-
369
-
370
-
371
-
372
-
373
-
374
-
375
-
376
-
377
-
378
-
379
-
380
-
381
-
382
-
383
-
384
-
385
-
386
-
387
-
388
-
389
-
390
-
391
-
392
-
393
-
394
-
395
-
396
-
397
-
398
-
399
-
400
-
401
-
402
 |
 |
99
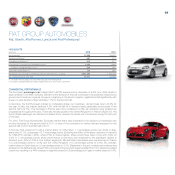
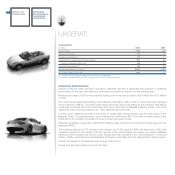
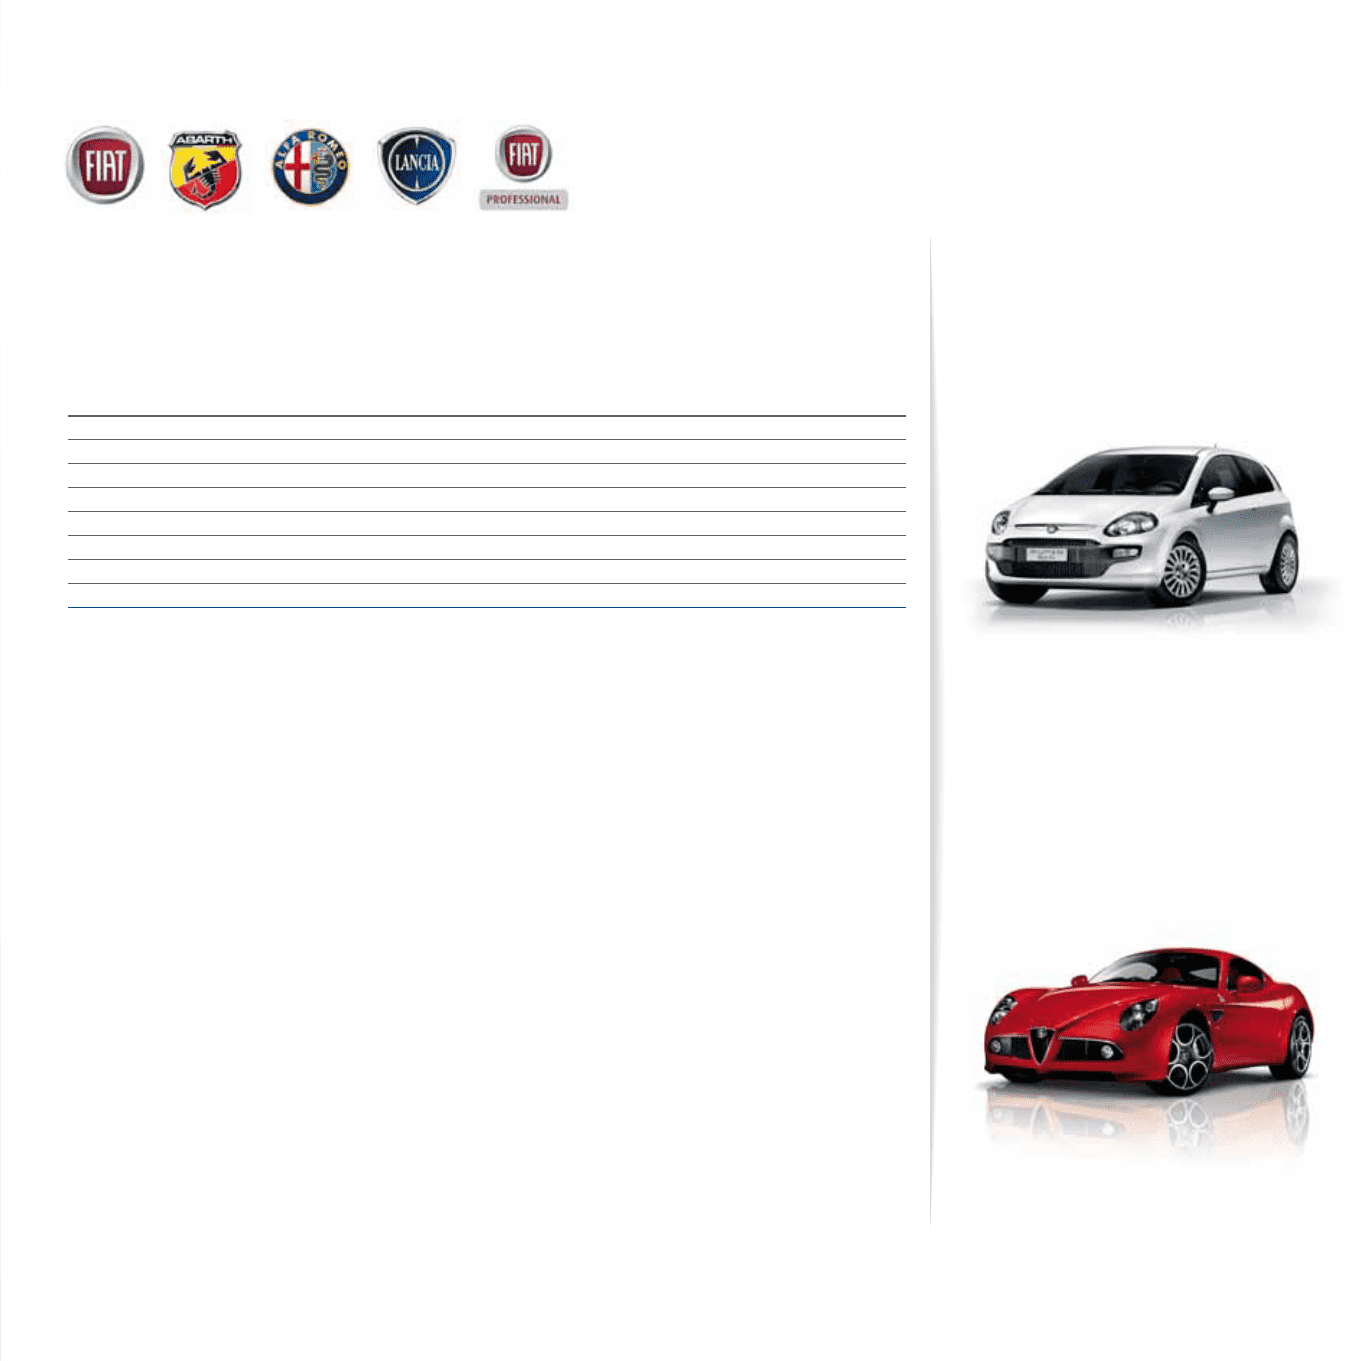
FIAT GROUP AUTOMOBILES
Fiat, Abarth, Alfa Romeo, Lancia and Fiat Professional
HIGHLIGHTS
(€ million) 2010 2009
Net revenues 27,860 26,293
Trading profit/(loss) 607 470
Operating profit/(loss) (*) 515 217
Investments in tangible and intangible assets 1,652 1,495
of which capitalized R&D costs 529 446
Total R&D expenditure (**) 722 669
Passenger cars and light commercial vehicles delivered (no. of units) 2,081,800 2,150,700
No. of employees at year end 57,611 54,038
(*) Includes restructuring costs and other unusual income/(expense)
(**) Includes capitalized R&D and R&D charged directly to the income statement
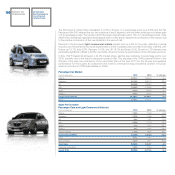
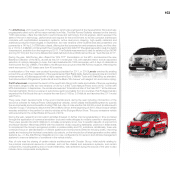
COMMERCIAL PERFORMANCE
The European passenger car market (EU27+EFTA) experienced a decrease of 4.9% over 2009 levels to
approximately 13.8 million vehicles. Demand in the first part of the year continued to be positively influenced by
government incentive programs. However, beginning in the second quarter, registrations fell significantly with
a year-on-year decline of approximately 11% for the second half.
In Germany, the first European market to completely phase out incentives, demand was down 23.4% for
the year. In Italy, the market declined 9.2%, with the fall off in demand being particularly pronounced in the
second half (-22.7%). The decrease in France was more contained (-2.2%), as incentives were phased out
progressively throughout the year. There was modest growth in the United Kingdom (+1.8%) and Spain (+3.1%)
and in Brazil passenger car demand increased 6.9%, despite the phase out of incentives during the first part
of the year.
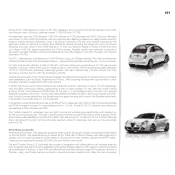
For 2010, Fiat Group Automobiles’ European market share was impacted by the decision to reschedule new
product launches for the second half of 2011, in view of the contraction in market demand expected for the
second half of 2010 and first half of 2011.
In Europe, FGA closed 2010 with a market share of 7.5% (down 1.1 percentage points over 2009). In Italy,
share was 30.1%, a decrease of 2.7 percentage points. Excluding the effect of the sharp reduction in demand
for CNG/LPG vehicles (-25%), where FGA is market leader, share would have been in line with 2009. At
3.0% (-1.7 percentage points), share performance in Germany was impacted by the significant decline in
demand (over 40%) in FGA’s core market segments. Modest share decreases were experienced in France
(-0.3 percentage points to 4.0%) and the United Kingdom (-0.5 percentage points to 3.0%). By contrast,
market share in Spain was up 0.5 percentage points to 3.0%. Elsewhere in Europe, notable performance was
achieved in the Netherlands, where FGA’s eco-performing product range benefited from CO2 emissions-based
incentives, resulting in a 44% increase in registrations and a 0.8 percentage point gain in market share to 6.4%.