Chrysler 2010 Annual Report Download - page 79
Download and view the complete annual report
Please find page 79 of the 2010 Chrysler annual report below. You can navigate through the pages in the report by either clicking on the pages listed below, or by using the keyword search tool below to find specific information within the annual report.-
 1
1 -
2
-
3
-
4
-
5
-
6
-
7
-
8
-
9
-
10
-
11
-
12
-
13
-
14
-
15
-
16
-
17
-
18
-
19
-
20
-
21
-
22
-
23
-
24
-
25
-
26
-
27
-
28
-
29
-
30
-
31
-
32
-
33
-
34
-
35
-
36
-
37
-
38
-
39
-
40
-
41
-
42
-
43
-
44
-
45
-
46
-
47
-
48
-
49
-
50
-
51
-
52
-
53
-
54
-
55
-
56
-
57
-
58
-
59
-
60
-
61
-
62
-
63
-
64
-
65
-
66
-
67
-
68
-
 69
69 -
 70
70 -
 71
71 -
 72
72 -
 73
73 -
 74
74 -
 75
75 -
 76
76 -
 77
77 -
 78
78 -
 79
79 -
 80
80 -
 81
81 -
 82
82 -
 83
83 -
 84
84 -
 85
85 -
 86
86 -
 87
87 -
 88
88 -
 89
89 -
90
-
91
-
92
-
93
-
94
-
95
-
96
-
97
-
98
-
99
-
100
-
101
-
102
-
103
-
104
-
105
-
106
-
107
-
108
-
109
-
110
-
111
-
112
-
113
-
114
-
115
-
116
-
117
-
118
-
119
-
120
-
121
-
122
-
123
-
124
-
125
-
126
-
127
-
128
-
129
-
130
-
131
-
132
-
133
-
134
-
135
-
136
-
137
-
138
-
139
-
140
-
141
-
142
-
143
-
144
-
145
-
146
-
147
-
148
-
149
-
150
-
151
-
152
-
153
-
154
-
155
-
156
-
157
-
158
-
159
-
160
-
161
-
162
-
163
-
164
-
165
-
166
-
167
-
168
-
169
-
170
-
171
-
172
-
173
-
174
-
175
-
176
-
177
-
178
-
179
-
180
-
181
-
182
-
183
-
184
-
185
-
186
-
187
-
188
-
189
-
190
-
191
-
192
-
193
-
194
-
195
-
196
-
197
-
198
-
199
-
200
-
201
-
202
-
203
-
204
-
205
-
206
-
207
-
208
-
209
-
210
-
211
-
212
-
213
-
214
-
215
-
216
-
217
-
218
-
219
-
220
-
221
-
222
-
223
-
224
-
225
-
226
-
227
-
228
-
229
-
230
-
231
-
232
-
233
-
234
-
235
-
236
-
237
-
238
-
239
-
240
-
241
-
242
-
243
-
244
-
245
-
246
-
247
-
248
-
249
-
250
-
251
-
252
-
253
-
254
-
255
-
256
-
257
-
258
-
259
-
260
-
261
-
262
-
263
-
264
-
265
-
266
-
267
-
268
-
269
-
270
-
271
-
272
-
273
-
274
-
275
-
276
-
277
-
278
-
279
-
280
-
281
-
282
-
283
-
284
-
285
-
286
-
287
-
288
-
289
-
290
-
291
-
292
-
293
-
294
-
295
-
296
-
297
-
298
-
299
-
300
-
301
-
302
-
303
-
304
-
305
-
306
-
307
-
308
-
309
-
310
-
311
-
312
-
313
-
314
-
315
-
316
-
317
-
318
-
319
-
320
-
321
-
322
-
323
-
324
-
325
-
326
-
327
-
328
-
329
-
330
-
331
-
332
-
333
-
334
-
335
-
336
-
337
-
338
-
339
-
340
-
341
-
342
-
343
-
344
-
345
-
346
-
347
-
348
-
349
-
350
-
351
-
352
-
353
-
354
-
355
-
356
-
357
-
358
-
359
-
360
-
361
-
362
-
363
-
364
-
365
-
366
-
367
-
368
-
369
-
370
-
371
-
372
-
373
-
374
-
375
-
376
-
377
-
378
-
379
-
380
-
381
-
382
-
383
-
384
-
385
-
386
-
387
-
388
-
389
-
390
-
391
-
392
-
393
-
394
-
395
-
396
-
397
-
398
-
399
-
400
-
401
-
402
 |
 |

REPORT ON
OPERATIONS
FINANCIAL
REVIEW –
FIAT GROUP
78
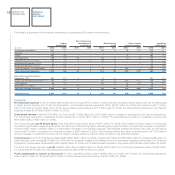
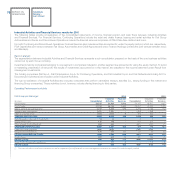
Industrial Activities
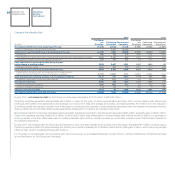
For 2010, net revenues for Industrial Activities were approximately €55 billion, up 12.4% over the previous year, when market conditions were particularly
weak.
Industrial Activities for Fiat post Demerger reported revenues of €35.7 billion, representing a 9.7% increase over 2009. Revenues for the Automobiles business
were up 6.1%, with favorable currency movements and LCV volumes more than offsetting the fall in passenger cars sales for FGA in Europe. Components
and Production Systems achieved a 23.6% increase in revenues on the back of higher demand.
Industrial Activities for Fiat Industrial benefited from significant volume recoveries for all businesses, with revenues up 19.6% to €20.2 billion. By business, CNH
achieved a 19.1% year-on-year improvement (+13.3% in US dollar terms), Iveco was up 15.9% and FPT Industrial 52.8%.
Industrial Activities reported a trading profit of €2,016 million, increasing €1,126 million over the €890 million figure for 2009.
For Fiat post Demerger, trading profit improved by €352 million to €1,047 million and for Fiat Industrial trading profit was up €774 million over 2009 to
€969 million.
The general improvement was attributable to higher volumes (with the exception of passenger cars for FGA), a better product mix and continued focus on
costs and industrial efficiencies.
Operating profit for Industrial Activities came in at €1,821 million for 2010, compared with €172 million for 2009. The increase was due to higher trading
profit (up €1,126 million) and a €523 million reduction in net unusual expenses.
For Fiat post Demerger, operating profit was €927 million (up €612 million, €352 million of which was due to higher trading profit), whereas Fiat Industrial went
from an operating loss of €143 million for 2009 to an operating profit of €894 million for 2010, principally driven by an improvement in trading profit.
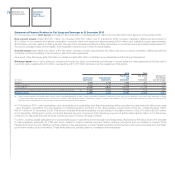
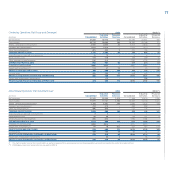
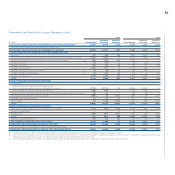
Financial Services
Net revenues for Financial Services totaled €1,649 million, up 12.4% compared to 2009.
(€ million)
2010 2009 % change
Fiat Group Automobiles 242 168 44.0
Ferrari 28 22 27.3
Total Continuing Operations 270 190 42.1
Agricultural and Construction Equipment (CNH – Case New Holland) 1,220 1,129 8.1
Trucks and Commercial Vehicles (Iveco) 159 151 5.3
Total Discontinued Operations 1,379 1,280 7.7
Eliminations - (3) -
Total Fiat Group 1,649 1,467 12.4
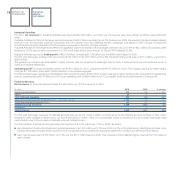
For Fiat post Demerger, revenues for financial services were up 42.1% to €270 million, primarily driven by the financial services activities of FGA, which
achieved a 44% increase to €242 million, up from €168 million in 2009 (+38% on a comparable scope of operations and at constant exchange rates)
predominantly due to the increase in business volumes outside Europe.
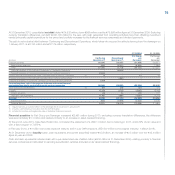
For Fiat Industrial, financial services generated net revenues of €1,379 million (up 7.7% on 2009). By sector:
Agricultural and Construction Equipment reported revenues of €1,220 million, up 8.1% over 2009 (+2.7% in US dollar terms), reflecting an increase in the
portfolio attributable to higher sales volumes for both the agricultural and construction equipment segments, in addition to positive currency effects.
Iveco had net revenues of €159 million, up 5.3% over the €151 million figure for 2009. That increase primarily reflected higher revenues from the resale of
used vehicles.