Chrysler 2010 Annual Report Download - page 183
Download and view the complete annual report
Please find page 183 of the 2010 Chrysler annual report below. You can navigate through the pages in the report by either clicking on the pages listed below, or by using the keyword search tool below to find specific information within the annual report.-
 1
1 -
2
-
3
-
4
-
5
-
6
-
7
-
8
-
9
-
10
-
11
-
12
-
13
-
14
-
15
-
16
-
17
-
18
-
19
-
20
-
21
-
22
-
23
-
24
-
25
-
26
-
27
-
28
-
29
-
30
-
31
-
32
-
33
-
34
-
35
-
36
-
37
-
38
-
39
-
40
-
41
-
42
-
43
-
44
-
45
-
46
-
47
-
48
-
49
-
50
-
51
-
52
-
53
-
54
-
55
-
56
-
57
-
58
-
59
-
60
-
61
-
62
-
63
-
64
-
65
-
66
-
67
-
68
-
69
-
70
-
71
-
72
-
73
-
74
-
75
-
76
-
77
-
78
-
79
-
80
-
81
-
82
-
83
-
84
-
85
-
86
-
87
-
88
-
89
-
90
-
91
-
92
-
93
-
94
-
95
-
96
-
97
-
98
-
99
-
100
-
101
-
102
-
103
-
104
-
105
-
106
-
107
-
108
-
109
-
110
-
111
-
112
-
113
-
114
-
115
-
116
-
117
-
118
-
119
-
120
-
121
-
122
-
123
-
124
-
125
-
126
-
127
-
128
-
129
-
130
-
131
-
132
-
133
-
134
-
135
-
136
-
137
-
138
-
139
-
140
-
141
-
142
-
143
-
144
-
145
-
146
-
147
-
148
-
149
-
150
-
151
-
152
-
153
-
154
-
155
-
156
-
157
-
158
-
159
-
160
-
161
-
162
-
163
-
164
-
165
-
166
-
167
-
168
-
169
-
170
-
171
-
172
-
 173
173 -
 174
174 -
 175
175 -
 176
176 -
 177
177 -
 178
178 -
 179
179 -
 180
180 -
 181
181 -
 182
182 -
 183
183 -
 184
184 -
 185
185 -
 186
186 -
 187
187 -
 188
188 -
 189
189 -
 190
190 -
 191
191 -
 192
192 -
 193
193 -
194
-
195
-
196
-
197
-
198
-
199
-
200
-
201
-
202
-
203
-
204
-
205
-
206
-
207
-
208
-
209
-
210
-
211
-
212
-
213
-
214
-
215
-
216
-
217
-
218
-
219
-
220
-
221
-
222
-
223
-
224
-
225
-
226
-
227
-
228
-
229
-
230
-
231
-
232
-
233
-
234
-
235
-
236
-
237
-
238
-
239
-
240
-
241
-
242
-
243
-
244
-
245
-
246
-
247
-
248
-
249
-
250
-
251
-
252
-
253
-
254
-
255
-
256
-
257
-
258
-
259
-
260
-
261
-
262
-
263
-
264
-
265
-
266
-
267
-
268
-
269
-
270
-
271
-
272
-
273
-
274
-
275
-
276
-
277
-
278
-
279
-
280
-
281
-
282
-
283
-
284
-
285
-
286
-
287
-
288
-
289
-
290
-
291
-
292
-
293
-
294
-
295
-
296
-
297
-
298
-
299
-
300
-
301
-
302
-
303
-
304
-
305
-
306
-
307
-
308
-
309
-
310
-
311
-
312
-
313
-
314
-
315
-
316
-
317
-
318
-
319
-
320
-
321
-
322
-
323
-
324
-
325
-
326
-
327
-
328
-
329
-
330
-
331
-
332
-
333
-
334
-
335
-
336
-
337
-
338
-
339
-
340
-
341
-
342
-
343
-
344
-
345
-
346
-
347
-
348
-
349
-
350
-
351
-
352
-
353
-
354
-
355
-
356
-
357
-
358
-
359
-
360
-
361
-
362
-
363
-
364
-
365
-
366
-
367
-
368
-
369
-
370
-
371
-
372
-
373
-
374
-
375
-
376
-
377
-
378
-
379
-
380
-
381
-
382
-
383
-
384
-
385
-
386
-
387
-
388
-
389
-
390
-
391
-
392
-
393
-
394
-
395
-
396
-
397
-
398
-
399
-
400
-
401
-
402
 |
 |

FIAT GROUP
CONSOLIDATED
FINANCIAL
STATEMENTS
AT 31 DECEMBER
2010
NOTES
182
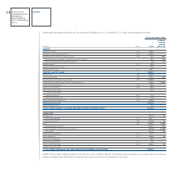
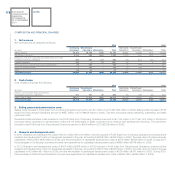
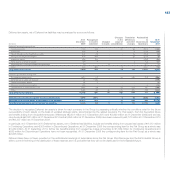
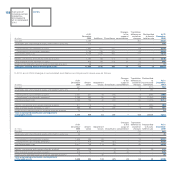
The reconciliation between the tax charges recorded in the consolidated financial statements and the theoretical tax charge, calculated on the basis of the
theoretical tax rate in effect in Italy, is the following:
(€ million) 2010 2009
Theoretical income taxes 352 (101)
Tax effect of permanent differences (8) 56
Taxes relating to prior years 8 24
Effect of difference between foreign tax rates and the theoretical Italian tax rate 121 45
Effect of deferred tax assets not recognised in prior years (61) -
Effect of deferred tax assets not recognised and write-off of deferred tax assets 161 426
Use of tax losses for which no deferred tax assets were recognised (17) (64)
Other differences 57 29
Current and deferred income tax recognised in the financial statements, excluding IRAP 613 415
IRAP (current and deferred) 69 66
Current and deferred income tax recognised in the financial statements 682 481
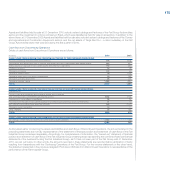
Since the IRAP tax has a taxable basis that is different from income before taxes, it generates distortions between one year and another. Accordingly,
in order to render the reconciliation between income taxes recognised and theoretical income taxes more meaningful, IRAP tax is not taken into consideration;
theoretical income taxes are determined by applying only the tax rate in effect in Italy (IRES equal to 27.5% in 2010 and 2009) to profit/(loss) before taxes
from Continuing and Discontinued operations, totalling €1,282 million.
Permanent differences in the above reconciliations include the tax effect of non-taxable income of €140 million in 2010 (€136 million in 2009) and of
non-deductible costs of €132 million in 2010 (€192 million in 2009).
Reconciling items relating to deferred tax assets gave rise to total tax expense of €83 million in 2010 (total tax expense of €362 million in 2009), consisting
of expense of €161 million resulting from the decision not to recognise assets deriving from temporary differences and tax losses arising during the year,
partially offset by income deriving from the recognition of previously unrecognised deferred tax assets of €61 million and the effect of utilising tax losses of
€17 million for which deferred tax assets had not been recognised in previous years.
Other differences in the above reconciliation include unrecoverable withholding tax of €89 million (€57 million in 2009).
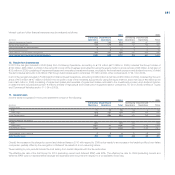
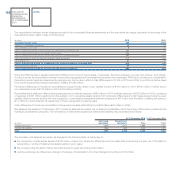
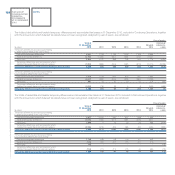
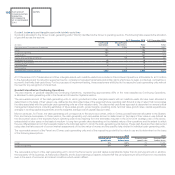
Net deferred tax assets at 31 December 2010 consist of deferred tax assets, net of deferred tax liabilities, which have been offset where possible by the
individual consolidated companies. The net balance of Deferred tax assets and Deferred tax liabilities may be analysed as follows:
At 31 December 2010 At 31 December 2009
Continuing Discontinued
(€ million) Operations Operations Total Total
Deferred tax assets 1,678 1,211 2,889 2,580
Deferred tax liabilities (135) (52) (187) (152)
Total 1,543 1,159 2,702 2,428
The increase in net deferred tax assets, as analysed in the following table, is mainly due to:
the recognition of deferred tax assets of €155 million, arising from temporary differences and tax losses that arose during the year, net of the effect of
recognising or writing off deferred tax assets relating to prior years;
the corresponding tax effect of items recorded directly in equity amounting to €3 million;
positive exchange rate differences, change in the scope of consolidation and other changes amounting to €116 million.