Chrysler 2010 Annual Report Download - page 174
Download and view the complete annual report
Please find page 174 of the 2010 Chrysler annual report below. You can navigate through the pages in the report by either clicking on the pages listed below, or by using the keyword search tool below to find specific information within the annual report.-
 1
1 -
2
-
3
-
4
-
5
-
6
-
7
-
8
-
9
-
10
-
11
-
12
-
13
-
14
-
15
-
16
-
17
-
18
-
19
-
20
-
21
-
22
-
23
-
24
-
25
-
26
-
27
-
28
-
29
-
30
-
31
-
32
-
33
-
34
-
35
-
36
-
37
-
38
-
39
-
40
-
41
-
42
-
43
-
44
-
45
-
46
-
47
-
48
-
49
-
50
-
51
-
52
-
53
-
54
-
55
-
56
-
57
-
58
-
59
-
60
-
61
-
62
-
63
-
64
-
65
-
66
-
67
-
68
-
69
-
70
-
71
-
72
-
73
-
74
-
75
-
76
-
77
-
78
-
79
-
80
-
81
-
82
-
83
-
84
-
85
-
86
-
87
-
88
-
89
-
90
-
91
-
92
-
93
-
94
-
95
-
96
-
97
-
98
-
99
-
100
-
101
-
102
-
103
-
104
-
105
-
106
-
107
-
108
-
109
-
110
-
111
-
112
-
113
-
114
-
115
-
116
-
117
-
118
-
119
-
120
-
121
-
122
-
123
-
124
-
125
-
126
-
127
-
128
-
129
-
130
-
131
-
132
-
133
-
134
-
135
-
136
-
137
-
138
-
139
-
140
-
141
-
142
-
143
-
144
-
145
-
146
-
147
-
148
-
149
-
150
-
151
-
152
-
153
-
154
-
155
-
156
-
157
-
158
-
159
-
160
-
161
-
162
-
163
-
 164
164 -
 165
165 -
 166
166 -
 167
167 -
 168
168 -
 169
169 -
 170
170 -
 171
171 -
 172
172 -
 173
173 -
 174
174 -
 175
175 -
 176
176 -
 177
177 -
 178
178 -
 179
179 -
 180
180 -
 181
181 -
 182
182 -
 183
183 -
 184
184 -
185
-
186
-
187
-
188
-
189
-
190
-
191
-
192
-
193
-
194
-
195
-
196
-
197
-
198
-
199
-
200
-
201
-
202
-
203
-
204
-
205
-
206
-
207
-
208
-
209
-
210
-
211
-
212
-
213
-
214
-
215
-
216
-
217
-
218
-
219
-
220
-
221
-
222
-
223
-
224
-
225
-
226
-
227
-
228
-
229
-
230
-
231
-
232
-
233
-
234
-
235
-
236
-
237
-
238
-
239
-
240
-
241
-
242
-
243
-
244
-
245
-
246
-
247
-
248
-
249
-
250
-
251
-
252
-
253
-
254
-
255
-
256
-
257
-
258
-
259
-
260
-
261
-
262
-
263
-
264
-
265
-
266
-
267
-
268
-
269
-
270
-
271
-
272
-
273
-
274
-
275
-
276
-
277
-
278
-
279
-
280
-
281
-
282
-
283
-
284
-
285
-
286
-
287
-
288
-
289
-
290
-
291
-
292
-
293
-
294
-
295
-
296
-
297
-
298
-
299
-
300
-
301
-
302
-
303
-
304
-
305
-
306
-
307
-
308
-
309
-
310
-
311
-
312
-
313
-
314
-
315
-
316
-
317
-
318
-
319
-
320
-
321
-
322
-
323
-
324
-
325
-
326
-
327
-
328
-
329
-
330
-
331
-
332
-
333
-
334
-
335
-
336
-
337
-
338
-
339
-
340
-
341
-
342
-
343
-
344
-
345
-
346
-
347
-
348
-
349
-
350
-
351
-
352
-
353
-
354
-
355
-
356
-
357
-
358
-
359
-
360
-
361
-
362
-
363
-
364
-
365
-
366
-
367
-
368
-
369
-
370
-
371
-
372
-
373
-
374
-
375
-
376
-
377
-
378
-
379
-
380
-
381
-
382
-
383
-
384
-
385
-
386
-
387
-
388
-
389
-
390
-
391
-
392
-
393
-
394
-
395
-
396
-
397
-
398
-
399
-
400
-
401
-
402
 |
 |

173
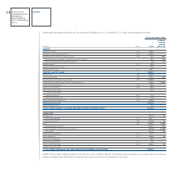
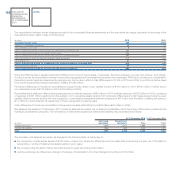
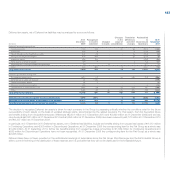
Post-tax profit/(Loss) from Discontinued Operations
Details of income statement items included in Discontinued Operations are as follows:
2010 2009
of which of which
Related Related
parties parties
(€ million) Note Total (Note 34) Total (Note 34)
Net revenues (1) 21,342 1,205 17,968 837
Cost of sales (2) 17,979 686 15,549 439
Selling, general and administrative costs (3) 1,793 162 1,636 180
Research and development costs (4) 418 42 388 26
Other income (expenses) (5) (60) 1 (73) 2
TRADING PROFIT/(LOSS) 1,092 322
Gains (losses) on the disposal of investments (6) 3 - 1 -
Restructuring costs (7) 58 - 144 -
Other unusual income (expenses) (8) (20) - (198) -
OPERATING PROFIT/(LOSS) 1,017 (19)
Financial income (expenses) (9) (505) (121) (401) (135)
Result from investments: (10) 64 64 (50) (50)
Share of the profit/(loss) of investees accounted for using the equity method 70 70 (47) (47)
Other income (expenses) from investments (6) (6) (3) (3)
PROFIT/(LOSS) BEFORE TAXES 576 (470)
Income taxes (11) 198 33
POST-TAX PROFIT/(LOSS) FROM DISCONTINUED OPERATIONS 378 (503)
PROFIT/(LOSS) FROM DISCONTINUED OPERATIONS ATTRIBUTABLE TO:
Owners of the parent 341 (464)
Non-controlling interests 37 (39)
Details of the main items included in Discontinued Operations are provided in the notes referred to above. Details of the main
items by segment are provided in note 30 Segment reporting.
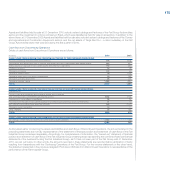
Assets and liabilities held for sale and Discontinued Operations
This item may be analysed as follows at 31 December 2010:
(€ million) At 31 December 2010 At 31 December 2009
Discontinued Operations 34,786 -
Assets held-for-sale of the continuing Fiat Group 68 82
Total Assets held-for-sale and Discontinued Operations 34,854 82
Discontinued Operations 29,920 -
Liabilities held-for-sale of the continuing Fiat Group - 8
Total Liabilities-held-for-sale and Discontinued Operations 29,920 8