Chrysler 2010 Annual Report Download - page 181
Download and view the complete annual report
Please find page 181 of the 2010 Chrysler annual report below. You can navigate through the pages in the report by either clicking on the pages listed below, or by using the keyword search tool below to find specific information within the annual report.-
 1
1 -
2
-
3
-
4
-
5
-
6
-
7
-
8
-
9
-
10
-
11
-
12
-
13
-
14
-
15
-
16
-
17
-
18
-
19
-
20
-
21
-
22
-
23
-
24
-
25
-
26
-
27
-
28
-
29
-
30
-
31
-
32
-
33
-
34
-
35
-
36
-
37
-
38
-
39
-
40
-
41
-
42
-
43
-
44
-
45
-
46
-
47
-
48
-
49
-
50
-
51
-
52
-
53
-
54
-
55
-
56
-
57
-
58
-
59
-
60
-
61
-
62
-
63
-
64
-
65
-
66
-
67
-
68
-
69
-
70
-
71
-
72
-
73
-
74
-
75
-
76
-
77
-
78
-
79
-
80
-
81
-
82
-
83
-
84
-
85
-
86
-
87
-
88
-
89
-
90
-
91
-
92
-
93
-
94
-
95
-
96
-
97
-
98
-
99
-
100
-
101
-
102
-
103
-
104
-
105
-
106
-
107
-
108
-
109
-
110
-
111
-
112
-
113
-
114
-
115
-
116
-
117
-
118
-
119
-
120
-
121
-
122
-
123
-
124
-
125
-
126
-
127
-
128
-
129
-
130
-
131
-
132
-
133
-
134
-
135
-
136
-
137
-
138
-
139
-
140
-
141
-
142
-
143
-
144
-
145
-
146
-
147
-
148
-
149
-
150
-
151
-
152
-
153
-
154
-
155
-
156
-
157
-
158
-
159
-
160
-
161
-
162
-
163
-
164
-
165
-
166
-
167
-
168
-
169
-
170
-
 171
171 -
 172
172 -
 173
173 -
 174
174 -
 175
175 -
 176
176 -
 177
177 -
 178
178 -
 179
179 -
 180
180 -
 181
181 -
 182
182 -
 183
183 -
 184
184 -
 185
185 -
 186
186 -
 187
187 -
 188
188 -
 189
189 -
 190
190 -
 191
191 -
192
-
193
-
194
-
195
-
196
-
197
-
198
-
199
-
200
-
201
-
202
-
203
-
204
-
205
-
206
-
207
-
208
-
209
-
210
-
211
-
212
-
213
-
214
-
215
-
216
-
217
-
218
-
219
-
220
-
221
-
222
-
223
-
224
-
225
-
226
-
227
-
228
-
229
-
230
-
231
-
232
-
233
-
234
-
235
-
236
-
237
-
238
-
239
-
240
-
241
-
242
-
243
-
244
-
245
-
246
-
247
-
248
-
249
-
250
-
251
-
252
-
253
-
254
-
255
-
256
-
257
-
258
-
259
-
260
-
261
-
262
-
263
-
264
-
265
-
266
-
267
-
268
-
269
-
270
-
271
-
272
-
273
-
274
-
275
-
276
-
277
-
278
-
279
-
280
-
281
-
282
-
283
-
284
-
285
-
286
-
287
-
288
-
289
-
290
-
291
-
292
-
293
-
294
-
295
-
296
-
297
-
298
-
299
-
300
-
301
-
302
-
303
-
304
-
305
-
306
-
307
-
308
-
309
-
310
-
311
-
312
-
313
-
314
-
315
-
316
-
317
-
318
-
319
-
320
-
321
-
322
-
323
-
324
-
325
-
326
-
327
-
328
-
329
-
330
-
331
-
332
-
333
-
334
-
335
-
336
-
337
-
338
-
339
-
340
-
341
-
342
-
343
-
344
-
345
-
346
-
347
-
348
-
349
-
350
-
351
-
352
-
353
-
354
-
355
-
356
-
357
-
358
-
359
-
360
-
361
-
362
-
363
-
364
-
365
-
366
-
367
-
368
-
369
-
370
-
371
-
372
-
373
-
374
-
375
-
376
-
377
-
378
-
379
-
380
-
381
-
382
-
383
-
384
-
385
-
386
-
387
-
388
-
389
-
390
-
391
-
392
-
393
-
394
-
395
-
396
-
397
-
398
-
399
-
400
-
401
-
402
 |
 |

FIAT GROUP
CONSOLIDATED
FINANCIAL
STATEMENTS
AT 31 DECEMBER
2010
NOTES
180
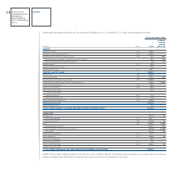
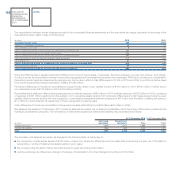
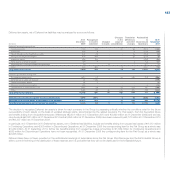
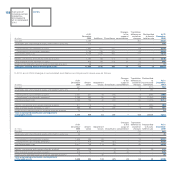
A reconciliation to the income statement is provided at the foot of the following table.
2010 2009
Continuing Discontinued Continuing Discontinued
(€ million) Operations Operations Eliminations Total Operations Operations Eliminations Total
Financial income:
Interest income and other financial income 239 36 - 275 112 41 - 153
Interest income from customers and other financial income
of financial services companies 173 777 - 950 112 806 - 918
Interest income receivable from Continuing Operations - 45 (45) - - 35 (35) -
Interest income receivables from Discontinued Operations 272 - (272) - 306 - (306) -
Gains on disposal of securities 10 - - 10 7 - - 7
Total Financial income 694 858 (317) 1,235 537 882 (341) 1,078
of which:
Financial income, excluding financial services companies (a) 508 77 (300) 285 418 68 (326) 160
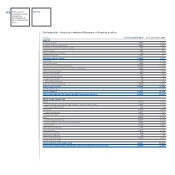
Interest cost and other financial expenses:
Interest expense and other financial expenses 1,049 658 - 1,707 876 561 - 1,437
Interest expense payable to Continuing Operations - 260 (260) - - 299 (299) -
Interest expense payable to Discontinued Operations 45 - (45) - 35 - (35) -
Write-downs of financial assets 57 253 - 310 5 189 - 194
Losses on disposal of securities 12 - - 12 12 - - 12
Interest costs on employee benefits 50 75 - 125 68 92 - 160
Total Interest and other financial expenses 1,213 1,246 (305) 2,154 996 1,141 (334) 1,803
Net income (expenses) from derivative financial instruments
and exchange differences 198 (97) - 101 163 (77) - 86
of which:
Interest cost and other financial expenses, effects resulting
from derivative financial instruments and exchange differences,
excluding financial services companies (b) 908 582 (300) 1,190 770 469 (326) 913
Net financial income (expenses) excluding
financial services companies (a) – (b) (400) (505) - (905) (352) (401) - (753)
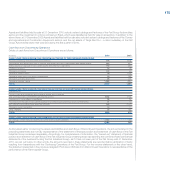
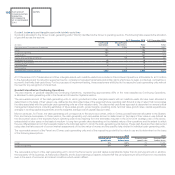
Net financial expenses from Continuing Operations in 2010 (excluding financial services companies) totalled €400 million, and include net financial income
of €111 million arising from the equity swaps on Fiat shares, relating to certain stock option plans (see Note 21 for further details). Net financial expense
from Continuing Operations of €352 million in 2009 included net income of €117 million arising from the above mentioned equity swaps on Fiat shares.
Net financial expenses from Discontinued Operations in 2010 (excluding financial services companies) totalled €505 million (financial expenses of
€401 million in 2009).
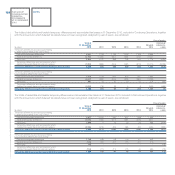
Interest income and other financial income may be analysed as follows:
2010 2009
Continuing Discontinued Continuing Discontinued
(€ million) Operations Operations Total Operations Operations Total
Interest income from banks 125 9 134 47 15 62
Interest income from securities 7 - 7 9 - 9
Commission income 1 - 1 1 - 1
Other interest income and financial income 106 27 133 55 26 81
Total Interest income and other financial income 239 36 275 112 41 153