Chrysler 2010 Annual Report Download - page 240
Download and view the complete annual report
Please find page 240 of the 2010 Chrysler annual report below. You can navigate through the pages in the report by either clicking on the pages listed below, or by using the keyword search tool below to find specific information within the annual report.-
 1
1 -
2
-
3
-
4
-
5
-
6
-
7
-
8
-
9
-
10
-
11
-
12
-
13
-
14
-
15
-
16
-
17
-
18
-
19
-
20
-
21
-
22
-
23
-
24
-
25
-
26
-
27
-
28
-
29
-
30
-
31
-
32
-
33
-
34
-
35
-
36
-
37
-
38
-
39
-
40
-
41
-
42
-
43
-
44
-
45
-
46
-
47
-
48
-
49
-
50
-
51
-
52
-
53
-
54
-
55
-
56
-
57
-
58
-
59
-
60
-
61
-
62
-
63
-
64
-
65
-
66
-
67
-
68
-
69
-
70
-
71
-
72
-
73
-
74
-
75
-
76
-
77
-
78
-
79
-
80
-
81
-
82
-
83
-
84
-
85
-
86
-
87
-
88
-
89
-
90
-
91
-
92
-
93
-
94
-
95
-
96
-
97
-
98
-
99
-
100
-
101
-
102
-
103
-
104
-
105
-
106
-
107
-
108
-
109
-
110
-
111
-
112
-
113
-
114
-
115
-
116
-
117
-
118
-
119
-
120
-
121
-
122
-
123
-
124
-
125
-
126
-
127
-
128
-
129
-
130
-
131
-
132
-
133
-
134
-
135
-
136
-
137
-
138
-
139
-
140
-
141
-
142
-
143
-
144
-
145
-
146
-
147
-
148
-
149
-
150
-
151
-
152
-
153
-
154
-
155
-
156
-
157
-
158
-
159
-
160
-
161
-
162
-
163
-
164
-
165
-
166
-
167
-
168
-
169
-
170
-
171
-
172
-
173
-
174
-
175
-
176
-
177
-
178
-
179
-
180
-
181
-
182
-
183
-
184
-
185
-
186
-
187
-
188
-
189
-
190
-
191
-
192
-
193
-
194
-
195
-
196
-
197
-
198
-
199
-
200
-
201
-
202
-
203
-
204
-
205
-
206
-
207
-
208
-
209
-
210
-
211
-
212
-
213
-
214
-
215
-
216
-
217
-
218
-
219
-
220
-
221
-
222
-
223
-
224
-
225
-
226
-
227
-
228
-
229
-
 230
230 -
 231
231 -
 232
232 -
 233
233 -
 234
234 -
 235
235 -
 236
236 -
 237
237 -
 238
238 -
 239
239 -
 240
240 -
 241
241 -
 242
242 -
 243
243 -
 244
244 -
 245
245 -
 246
246 -
 247
247 -
 248
248 -
 249
249 -
 250
250 -
251
-
252
-
253
-
254
-
255
-
256
-
257
-
258
-
259
-
260
-
261
-
262
-
263
-
264
-
265
-
266
-
267
-
268
-
269
-
270
-
271
-
272
-
273
-
274
-
275
-
276
-
277
-
278
-
279
-
280
-
281
-
282
-
283
-
284
-
285
-
286
-
287
-
288
-
289
-
290
-
291
-
292
-
293
-
294
-
295
-
296
-
297
-
298
-
299
-
300
-
301
-
302
-
303
-
304
-
305
-
306
-
307
-
308
-
309
-
310
-
311
-
312
-
313
-
314
-
315
-
316
-
317
-
318
-
319
-
320
-
321
-
322
-
323
-
324
-
325
-
326
-
327
-
328
-
329
-
330
-
331
-
332
-
333
-
334
-
335
-
336
-
337
-
338
-
339
-
340
-
341
-
342
-
343
-
344
-
345
-
346
-
347
-
348
-
349
-
350
-
351
-
352
-
353
-
354
-
355
-
356
-
357
-
358
-
359
-
360
-
361
-
362
-
363
-
364
-
365
-
366
-
367
-
368
-
369
-
370
-
371
-
372
-
373
-
374
-
375
-
376
-
377
-
378
-
379
-
380
-
381
-
382
-
383
-
384
-
385
-
386
-
387
-
388
-
389
-
390
-
391
-
392
-
393
-
394
-
395
-
396
-
397
-
398
-
399
-
400
-
401
-
402
 |
 |

239
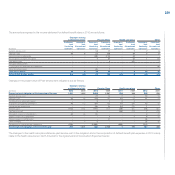
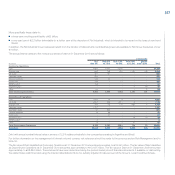
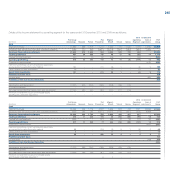
Net financial position
In compliance with Consob Regulation issued on 28 July 2006 and in conformity with the CESR’s “Recommendations for the consistent implementation of
the European Commission’s Regulation on Prospectuses” issued on 10 February 2005, the Net financial position of the Group is as follows:
At 31 December 2010 At 31 December 2009
Continuing Discontinued
Operations Operations Fiat Group before Demerger of which
of which Re- Related
(€ million)
Total lated parties Total parties
A. Cash and cash equivalents 11,967 3,686 15,653 - 12,226 651
B. Current securities (securities held for trading) 185 24 209 - 217 -
C. Liquidity (C) = (A+B) 12,152 3,710 15,862 - 12,443 651
D. Receivables from financing activities (Current financial receivables) 2,866 10,908 13,774 129 12,695 120
of which: From jointly controlled financial services entities 12 - 12 12 14 14
E. Financial receivables from Discontinued/Continuing Operations 5,626 2,865 - - - -
F. Other financial assets 516 88 604 - 636 52
G. Debt 20,804 18,695 31,008 553 28,527 1,144
H. Other financial liabilities 255 147 402 - 464 49
I. Net financial position (I) = (C+D+E+F-G-H) 101 (1,271) (1,170) (424) (3,217) (370)
The item Receivables from financing activities includes the entire portfolio of the financial services entities, classified as current assets as they will be realised
during the normal operating cycle of these companies.
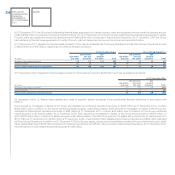
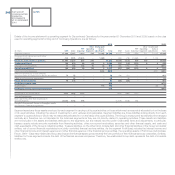
The following is a reconciliation between the Net financial position as presented in the above table and Net debt as presented in the Report on Operations:
At 31 December 2010 At 31 December 2009
Continuing Discontinued
(€ million) Operations Operations Total Total
Consolidated net debt as presented in the Report on Operations (2,753) (12,179) (14,932) (15,898)
Less: Current financial receivables, excluding those due from jointly controlled
financial services companies relating to Continuing Operations, amounting
to €12 million at 31 December 2010 (€14 million at 31 December 2009) 2,854 10,908 13,762 12,681
Net financial position 101 (1,271) (1,170) (3,217)
Reference should be made to Notes 19, 20, 21 and 22 and the information provided in this Note for a further analysis of the items in the table.