Chrysler 2010 Annual Report Download - page 205
Download and view the complete annual report
Please find page 205 of the 2010 Chrysler annual report below. You can navigate through the pages in the report by either clicking on the pages listed below, or by using the keyword search tool below to find specific information within the annual report.-
 1
1 -
2
-
3
-
4
-
5
-
6
-
7
-
8
-
9
-
10
-
11
-
12
-
13
-
14
-
15
-
16
-
17
-
18
-
19
-
20
-
21
-
22
-
23
-
24
-
25
-
26
-
27
-
28
-
29
-
30
-
31
-
32
-
33
-
34
-
35
-
36
-
37
-
38
-
39
-
40
-
41
-
42
-
43
-
44
-
45
-
46
-
47
-
48
-
49
-
50
-
51
-
52
-
53
-
54
-
55
-
56
-
57
-
58
-
59
-
60
-
61
-
62
-
63
-
64
-
65
-
66
-
67
-
68
-
69
-
70
-
71
-
72
-
73
-
74
-
75
-
76
-
77
-
78
-
79
-
80
-
81
-
82
-
83
-
84
-
85
-
86
-
87
-
88
-
89
-
90
-
91
-
92
-
93
-
94
-
95
-
96
-
97
-
98
-
99
-
100
-
101
-
102
-
103
-
104
-
105
-
106
-
107
-
108
-
109
-
110
-
111
-
112
-
113
-
114
-
115
-
116
-
117
-
118
-
119
-
120
-
121
-
122
-
123
-
124
-
125
-
126
-
127
-
128
-
129
-
130
-
131
-
132
-
133
-
134
-
135
-
136
-
137
-
138
-
139
-
140
-
141
-
142
-
143
-
144
-
145
-
146
-
147
-
148
-
149
-
150
-
151
-
152
-
153
-
154
-
155
-
156
-
157
-
158
-
159
-
160
-
161
-
162
-
163
-
164
-
165
-
166
-
167
-
168
-
169
-
170
-
171
-
172
-
173
-
174
-
175
-
176
-
177
-
178
-
179
-
180
-
181
-
182
-
183
-
184
-
185
-
186
-
187
-
188
-
189
-
190
-
191
-
192
-
193
-
194
-
 195
195 -
 196
196 -
 197
197 -
 198
198 -
 199
199 -
 200
200 -
 201
201 -
 202
202 -
 203
203 -
 204
204 -
 205
205 -
 206
206 -
 207
207 -
 208
208 -
 209
209 -
 210
210 -
 211
211 -
 212
212 -
 213
213 -
 214
214 -
 215
215 -
216
-
217
-
218
-
219
-
220
-
221
-
222
-
223
-
224
-
225
-
226
-
227
-
228
-
229
-
230
-
231
-
232
-
233
-
234
-
235
-
236
-
237
-
238
-
239
-
240
-
241
-
242
-
243
-
244
-
245
-
246
-
247
-
248
-
249
-
250
-
251
-
252
-
253
-
254
-
255
-
256
-
257
-
258
-
259
-
260
-
261
-
262
-
263
-
264
-
265
-
266
-
267
-
268
-
269
-
270
-
271
-
272
-
273
-
274
-
275
-
276
-
277
-
278
-
279
-
280
-
281
-
282
-
283
-
284
-
285
-
286
-
287
-
288
-
289
-
290
-
291
-
292
-
293
-
294
-
295
-
296
-
297
-
298
-
299
-
300
-
301
-
302
-
303
-
304
-
305
-
306
-
307
-
308
-
309
-
310
-
311
-
312
-
313
-
314
-
315
-
316
-
317
-
318
-
319
-
320
-
321
-
322
-
323
-
324
-
325
-
326
-
327
-
328
-
329
-
330
-
331
-
332
-
333
-
334
-
335
-
336
-
337
-
338
-
339
-
340
-
341
-
342
-
343
-
344
-
345
-
346
-
347
-
348
-
349
-
350
-
351
-
352
-
353
-
354
-
355
-
356
-
357
-
358
-
359
-
360
-
361
-
362
-
363
-
364
-
365
-
366
-
367
-
368
-
369
-
370
-
371
-
372
-
373
-
374
-
375
-
376
-
377
-
378
-
379
-
380
-
381
-
382
-
383
-
384
-
385
-
386
-
387
-
388
-
389
-
390
-
391
-
392
-
393
-
394
-
395
-
396
-
397
-
398
-
399
-
400
-
401
-
402
 |
 |

FIAT GROUP
CONSOLIDATED
FINANCIAL
STATEMENTS
AT 31 DECEMBER
2010
NOTES
204
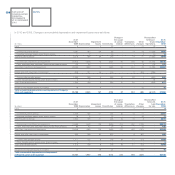
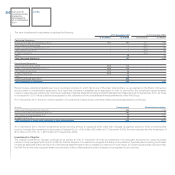
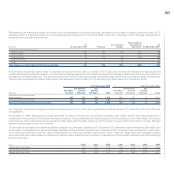
At 31 December 2010, Total Current receivables include receivables sold and financed through both securitisation and factoring transactions of
€8,089 million (€6,588 million at 31 December 2009) which do not meet IAS 39 derecognition requirements. These receivables are recognised as such
in the Group financial statements even though they have been legally sold; a corresponding financial liability is recorded in the consolidated statement of
financial position as Asset-backed financing (see Note 26). At 31 December 2010, this amount is included in Continuing Operations for €533 million and in
Discontinued Operations for €7,556 million.
Trade receivables
Trade receivables amount to €4,050 million at 31 December 2010, of which €2,259 million classified as Continuing Operations and €1,791 million classified
as Discontinued Operations. The total balance increased by €401 million over that at 31 December 2009. Excluding translation exchange differences there
was an increase of €245 million, almost all relating to Continuing Operations and in particular to the increase in business volumes in the FGA sector in Brazil.
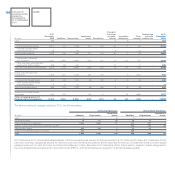
Trade receivables are shown net of allowances for doubtful accounts of €465 million at 31 December 2010 (€524 million at 31 December 2009), of which
€290 million classified as Continuing Operations and €175 million as Discontinued Operations. Changes in these allowances, which are calculated on the
basis of historical losses on receivables, were are as follows in 2010:
Reclassified
At 31 Use Change in to Disconti- At 31
December and other the scope of nued December
(€ million) 2009 Provision changes consolidation Operations 2010
Allowances for doubtful accounts 524 96 (162) 7 (175) 290
The carrying amount of Trade receivables is considered in line with their fair value.
At 31 December 2010, trade receivables of €8 million classified as Continuing Operations were pledged as security for loans obtained (€14 million at
31 December 2009).
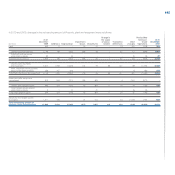
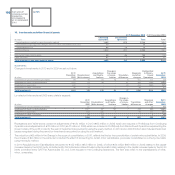
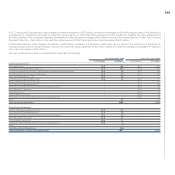
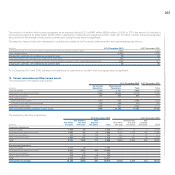
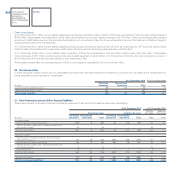
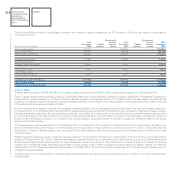
Receivables from financing activities
Receivables from financing activities include the following:
At 31 December 2010 At 31 December 2009
Continuing Discontinued
(€ million) Operations Operations Total Total
Retail financing 731 6,219 6,950 6,239
Finance leases 243 812 1,055 1,110
Dealer financing 1,724 3,857 5,581 5,108
Supplier financing 48 - 48 102
Current financial receivables from jointly controlled financial services entities 12 - 12 14
Financial receivables from companies under joint control, associates and unconsolidated subsidiaries 49 - 49 55
Other 59 20 79 67
Total Receivables from financing activities 2,866 10,908 13,774 12,695
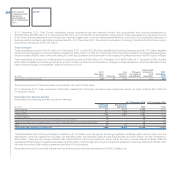
Total Receivables from financing activities increased by €1,079 million over the period. Excluding translation exchange gains, arising mainly from the
depreciation of the Euro against the US Dollar, the Australian Dollar, the Canadian Dollar and the Brazilian Real, and write-downs, the item increased by
€259 million. There was an increase of €594 million attributable to Continuing Operations, mainly due to the rise in volumes financed in Brazil, while the
receivables of Discontinued Operations decreased by €335 million, due amongst other things to the gradual settlement of the loans disbursed in Brazil which
fell under the scope of debt relief programmes (see Note 32 in this respect).
Receivables from jointly controlled financial services entities include financial receivables by the FGA Capital group.