Chrysler 2010 Annual Report Download - page 67
Download and view the complete annual report
Please find page 67 of the 2010 Chrysler annual report below. You can navigate through the pages in the report by either clicking on the pages listed below, or by using the keyword search tool below to find specific information within the annual report.-
 1
1 -
2
-
3
-
4
-
5
-
6
-
7
-
8
-
9
-
10
-
11
-
12
-
13
-
14
-
15
-
16
-
17
-
18
-
19
-
20
-
21
-
22
-
23
-
24
-
25
-
26
-
27
-
28
-
29
-
30
-
31
-
32
-
33
-
34
-
35
-
36
-
37
-
38
-
39
-
40
-
41
-
42
-
43
-
44
-
45
-
46
-
47
-
48
-
49
-
50
-
51
-
52
-
53
-
54
-
55
-
56
-
 57
57 -
 58
58 -
 59
59 -
 60
60 -
 61
61 -
 62
62 -
 63
63 -
 64
64 -
 65
65 -
 66
66 -
 67
67 -
 68
68 -
 69
69 -
 70
70 -
 71
71 -
 72
72 -
 73
73 -
 74
74 -
 75
75 -
 76
76 -
 77
77 -
78
-
79
-
80
-
81
-
82
-
83
-
84
-
85
-
86
-
87
-
88
-
89
-
90
-
91
-
92
-
93
-
94
-
95
-
96
-
97
-
98
-
99
-
100
-
101
-
102
-
103
-
104
-
105
-
106
-
107
-
108
-
109
-
110
-
111
-
112
-
113
-
114
-
115
-
116
-
117
-
118
-
119
-
120
-
121
-
122
-
123
-
124
-
125
-
126
-
127
-
128
-
129
-
130
-
131
-
132
-
133
-
134
-
135
-
136
-
137
-
138
-
139
-
140
-
141
-
142
-
143
-
144
-
145
-
146
-
147
-
148
-
149
-
150
-
151
-
152
-
153
-
154
-
155
-
156
-
157
-
158
-
159
-
160
-
161
-
162
-
163
-
164
-
165
-
166
-
167
-
168
-
169
-
170
-
171
-
172
-
173
-
174
-
175
-
176
-
177
-
178
-
179
-
180
-
181
-
182
-
183
-
184
-
185
-
186
-
187
-
188
-
189
-
190
-
191
-
192
-
193
-
194
-
195
-
196
-
197
-
198
-
199
-
200
-
201
-
202
-
203
-
204
-
205
-
206
-
207
-
208
-
209
-
210
-
211
-
212
-
213
-
214
-
215
-
216
-
217
-
218
-
219
-
220
-
221
-
222
-
223
-
224
-
225
-
226
-
227
-
228
-
229
-
230
-
231
-
232
-
233
-
234
-
235
-
236
-
237
-
238
-
239
-
240
-
241
-
242
-
243
-
244
-
245
-
246
-
247
-
248
-
249
-
250
-
251
-
252
-
253
-
254
-
255
-
256
-
257
-
258
-
259
-
260
-
261
-
262
-
263
-
264
-
265
-
266
-
267
-
268
-
269
-
270
-
271
-
272
-
273
-
274
-
275
-
276
-
277
-
278
-
279
-
280
-
281
-
282
-
283
-
284
-
285
-
286
-
287
-
288
-
289
-
290
-
291
-
292
-
293
-
294
-
295
-
296
-
297
-
298
-
299
-
300
-
301
-
302
-
303
-
304
-
305
-
306
-
307
-
308
-
309
-
310
-
311
-
312
-
313
-
314
-
315
-
316
-
317
-
318
-
319
-
320
-
321
-
322
-
323
-
324
-
325
-
326
-
327
-
328
-
329
-
330
-
331
-
332
-
333
-
334
-
335
-
336
-
337
-
338
-
339
-
340
-
341
-
342
-
343
-
344
-
345
-
346
-
347
-
348
-
349
-
350
-
351
-
352
-
353
-
354
-
355
-
356
-
357
-
358
-
359
-
360
-
361
-
362
-
363
-
364
-
365
-
366
-
367
-
368
-
369
-
370
-
371
-
372
-
373
-
374
-
375
-
376
-
377
-
378
-
379
-
380
-
381
-
382
-
383
-
384
-
385
-
386
-
387
-
388
-
389
-
390
-
391
-
392
-
393
-
394
-
395
-
396
-
397
-
398
-
399
-
400
-
401
-
402
 |
 |

REPORT ON
OPERATIONS
FINANCIAL
REVIEW –
FIAT GROUP
66
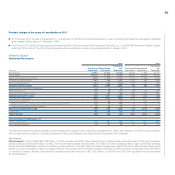
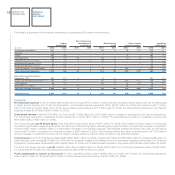
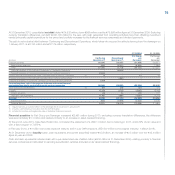
Revenues by business
(€ million) 2010 2009 % change
Automobiles (Fiat Group Automobiles, Maserati, Ferrari) 30,130 28,351 6.3
Components and Production Systems (Fiat Powertrain (1), Magneti Marelli, Teksid, Comau) 10,865 8,789 23.6
Other Businesses (Publishing, Holding Companies and Other) 1,159 1,047 10.7
Eliminations (6,274) (5,503) -
Total Continuing Operations 35,880 32,684 9.8
Agricultural and Construction Equipment (CNH-Case New Holland) 11,906 10,107 17.8
Trucks and Commercial Vehicles (Iveco) 8,307 7,183 15.6
FPT Industrial (1) 2,415 1,580 52.8
Eliminations and Other (1,286) (902) -
Total Discontinued Operations 21,342 17,968 18.8
Eliminations between Continuing and Discontinued Operations (964) (550) -
Total Fiat Group 56,258 50,102 12.3
(1) Fiat Powertrain comprises the activities of the Passenger & Commercial Vehicles business line of the former FPT Powertrain Technologies, while FPT Industrial comprises the activities of the
Industrial & Marine business line
Following is a review of net revenues by business/sector:
Continuing Operations
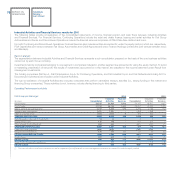
Automobiles
In 2010, the Automobiles businesses had revenues of €30,130 million, up 6.3% over 2009.
(€ million) 2010 2009 % change
Fiat Group Automobiles 27,860 26,293 6.0
Maserati 586 448 30.8
Ferrari 1,919 1,778 7.9
Eliminations (235) (168) -
Total 30,130 28,351 6.3
Fiat Group Automobiles (FGA) posted revenues of €27,860 million for the year, representing a 6% increase over 2009 (+0.5% at constant exchange
rates), with the impact of the decline in passenger car volumes (-8.2%) compensated for by the significant increase for light commercial vehicles (+27.1%).
In total, FGA delivered 2,081,800 passengers cars and light commercial vehicles, down 3.2% over the prior year.
For passenger cars only, FGA delivered 1,691,400 vehicles, an 8.2% decrease over 2009. In Europe, deliveries were down 15.1% to 963,000 vehicles,
with the reduction also reflecting measures to realign dealer inventory levels to market demand. Deliveries in Italy (-16.3%) and Germany (-53.2%) were
heavily impacted by the significant decline in demand for smaller and CNG/LPG vehicles, following the phase-out of eco-incentives. Deliveries were also
down in the United Kingdom (-17.5%), but remained stable in France (+0.9%) and were up in Spain (+48.3%), against particularly low 2009 volumes.
Notable results were achieved in several of the sector’s smaller markets.
In Europe, where the passenger vehicle market was down 4.9% over the prior year, Fiat Group Automobiles closed 2010 with a market share of 7.5% (-1.1
percentage points over 2009). In Italy, share was 30.1%, a decrease of 2.7 percentage points. Excluding the effect of the sharp reduction in demand for
CNG/LPG vehicles (-25%), where FGA is market leader, share would have been in line with 2009. At 3.0% (-1.7 percentage points), share performance in
Germany was impacted by the significant decline in demand (over 40%) in FGA’s core market segments. Modest decreases in share were experienced
in France (-0.3 percentage points to 4.0%) and the United Kingdom (-0.5 percentage points to 3.0%). By contrast, market share in Spain was up 0.5
percentage points to 3.0%.