Chrysler 2010 Annual Report Download - page 260
Download and view the complete annual report
Please find page 260 of the 2010 Chrysler annual report below. You can navigate through the pages in the report by either clicking on the pages listed below, or by using the keyword search tool below to find specific information within the annual report.-
 1
1 -
2
-
3
-
4
-
5
-
6
-
7
-
8
-
9
-
10
-
11
-
12
-
13
-
14
-
15
-
16
-
17
-
18
-
19
-
20
-
21
-
22
-
23
-
24
-
25
-
26
-
27
-
28
-
29
-
30
-
31
-
32
-
33
-
34
-
35
-
36
-
37
-
38
-
39
-
40
-
41
-
42
-
43
-
44
-
45
-
46
-
47
-
48
-
49
-
50
-
51
-
52
-
53
-
54
-
55
-
56
-
57
-
58
-
59
-
60
-
61
-
62
-
63
-
64
-
65
-
66
-
67
-
68
-
69
-
70
-
71
-
72
-
73
-
74
-
75
-
76
-
77
-
78
-
79
-
80
-
81
-
82
-
83
-
84
-
85
-
86
-
87
-
88
-
89
-
90
-
91
-
92
-
93
-
94
-
95
-
96
-
97
-
98
-
99
-
100
-
101
-
102
-
103
-
104
-
105
-
106
-
107
-
108
-
109
-
110
-
111
-
112
-
113
-
114
-
115
-
116
-
117
-
118
-
119
-
120
-
121
-
122
-
123
-
124
-
125
-
126
-
127
-
128
-
129
-
130
-
131
-
132
-
133
-
134
-
135
-
136
-
137
-
138
-
139
-
140
-
141
-
142
-
143
-
144
-
145
-
146
-
147
-
148
-
149
-
150
-
151
-
152
-
153
-
154
-
155
-
156
-
157
-
158
-
159
-
160
-
161
-
162
-
163
-
164
-
165
-
166
-
167
-
168
-
169
-
170
-
171
-
172
-
173
-
174
-
175
-
176
-
177
-
178
-
179
-
180
-
181
-
182
-
183
-
184
-
185
-
186
-
187
-
188
-
189
-
190
-
191
-
192
-
193
-
194
-
195
-
196
-
197
-
198
-
199
-
200
-
201
-
202
-
203
-
204
-
205
-
206
-
207
-
208
-
209
-
210
-
211
-
212
-
213
-
214
-
215
-
216
-
217
-
218
-
219
-
220
-
221
-
222
-
223
-
224
-
225
-
226
-
227
-
228
-
229
-
230
-
231
-
232
-
233
-
234
-
235
-
236
-
237
-
238
-
239
-
240
-
241
-
242
-
243
-
244
-
245
-
246
-
247
-
248
-
249
-
 250
250 -
 251
251 -
 252
252 -
 253
253 -
 254
254 -
 255
255 -
 256
256 -
 257
257 -
 258
258 -
 259
259 -
 260
260 -
 261
261 -
 262
262 -
 263
263 -
 264
264 -
 265
265 -
 266
266 -
 267
267 -
 268
268 -
 269
269 -
 270
270 -
271
-
272
-
273
-
274
-
275
-
276
-
277
-
278
-
279
-
280
-
281
-
282
-
283
-
284
-
285
-
286
-
287
-
288
-
289
-
290
-
291
-
292
-
293
-
294
-
295
-
296
-
297
-
298
-
299
-
300
-
301
-
302
-
303
-
304
-
305
-
306
-
307
-
308
-
309
-
310
-
311
-
312
-
313
-
314
-
315
-
316
-
317
-
318
-
319
-
320
-
321
-
322
-
323
-
324
-
325
-
326
-
327
-
328
-
329
-
330
-
331
-
332
-
333
-
334
-
335
-
336
-
337
-
338
-
339
-
340
-
341
-
342
-
343
-
344
-
345
-
346
-
347
-
348
-
349
-
350
-
351
-
352
-
353
-
354
-
355
-
356
-
357
-
358
-
359
-
360
-
361
-
362
-
363
-
364
-
365
-
366
-
367
-
368
-
369
-
370
-
371
-
372
-
373
-
374
-
375
-
376
-
377
-
378
-
379
-
380
-
381
-
382
-
383
-
384
-
385
-
386
-
387
-
388
-
389
-
390
-
391
-
392
-
393
-
394
-
395
-
396
-
397
-
398
-
399
-
400
-
401
-
402
 |
 |

259
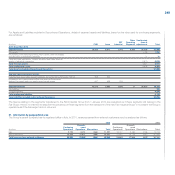
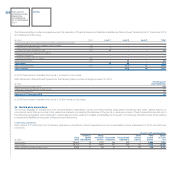
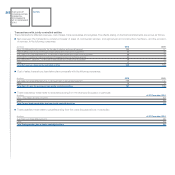
Trade payables: these relate to payables resulting from the costs discussed above and those arising from the Group’s trade relationships with FGA
Capital. In particular:
(€ million) At 31 December 2010 At 31 December 2009
Società Europea Veicoli Leggeri-Sevel S.p.A. 466 290
Tofas-Turk Otomobil Fabrikasi Tofas A.S. 220 250
FGA Capital 52 80
Société Européenne de Véhicules Légers du Nord-Sevelnord Société Anonyme 51 113
Other 9 60
Total Trade payables due to jointly controlled entities 798 793
Current receivables from financing activities: this item, amounting to €63 million at 31 December 2010 (€62 million at 31 December 2009), mainly relates
to receivables of the Group financial services companies due from jointly controlled entities.
Other current assets: this item, amounting to €34 million at 31 December 2010 (€36 million at 31 December 2009), relates mostly to other receivables
of €26 million due from FGA Capital at 31 December 2010 (€31 million at 31 December 2009).
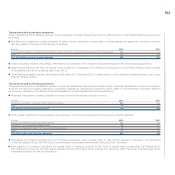
Asset-backed financing: this item, amounting to €92 million at 31 December 2010 (€96 million at 31 December 2009), relates to amounts due to
FGA Capital for sales of receivables which do not qualify as sales under IAS 39.
Other financial payables: this item, amounting to €146 million at 31 December 2010 (€209 million at 31 December 2009), includes €144 million of other
payables of a financial nature due to FGA Capital (€96 million at 31 December 2009).
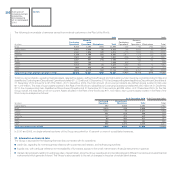
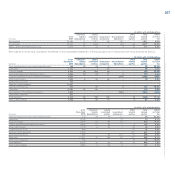
Transactions with associated companies
These transactions mainly affected revenues, trade receivables and asset backed-financing and other financial payables. The effects arising on the financial
statements are set out as follows.
Net Revenues: transactions consist principally of sales of motor vehicles and components, including engines and gearboxes, production systems,
and the provision of services, to the following companies:
(€ million) 2010 2009
Chrysler, for the sale of components and production systems 195 31
To-dis S.r.l. for the sale of publishing products and other 49 55
Total Net Revenues from associated companies 244 86
Cost of sales: transactions consist principally of the purchase of vehicles by the following companies:
(€ million) 2010 2009
Chrysler, for the purchase of vehicles 226 -
Others 5 7
Total cost of sales from associated companies 231 7