Chrysler 2010 Annual Report Download - page 68
Download and view the complete annual report
Please find page 68 of the 2010 Chrysler annual report below. You can navigate through the pages in the report by either clicking on the pages listed below, or by using the keyword search tool below to find specific information within the annual report.-
 1
1 -
 2
2 -
 3
3 -
 4
4 -
 5
5 -
 6
6 -
 7
7 -
 8
8 -
 9
9 -
 10
10 -
 11
11 -
 12
12 -
 13
13 -
 14
14 -
 15
15 -
 16
16 -
 17
17 -
 18
18 -
 19
19 -
 20
20 -
 21
21 -
 22
22 -
 23
23 -
 24
24 -
 25
25 -
 26
26 -
 27
27 -
 28
28 -
 29
29 -
 30
30 -
 31
31 -
 32
32 -
 33
33 -
 34
34 -
 35
35 -
 36
36 -
 37
37 -
 38
38 -
 39
39 -
 40
40 -
 41
41 -
 42
42 -
 43
43 -
 44
44 -
 45
45 -
 46
46 -
 47
47 -
 48
48 -
 49
49 -
 50
50 -
 51
51 -
 52
52 -
 53
53 -
 54
54 -
 55
55 -
 56
56 -
 57
57 -
 58
58 -
 59
59 -
 60
60 -
 61
61 -
 62
62 -
 63
63 -
 64
64 -
 65
65 -
 66
66 -
 67
67 -
 68
68 -
 69
69 -
 70
70 -
 71
71 -
 72
72 -
 73
73 -
 74
74 -
 75
75 -
 76
76 -
 77
77 -
 78
78 -
 79
79 -
 80
80 -
 81
81 -
 82
82 -
 83
83 -
 84
84 -
 85
85 -
 86
86 -
 87
87 -
 88
88 -
 89
89 -
 90
90 -
 91
91 -
 92
92 -
 93
93 -
 94
94 -
 95
95 -
 96
96 -
 97
97 -
 98
98 -
 99
99 -
 100
100 -
 101
101 -
 102
102 -
 103
103 -
 104
104 -
 105
105 -
 106
106 -
 107
107 -
 108
108 -
 109
109 -
 110
110 -
 111
111 -
 112
112 -
 113
113 -
 114
114 -
 115
115 -
 116
116 -
 117
117 -
 118
118 -
 119
119 -
 120
120 -
 121
121 -
 122
122 -
 123
123 -
 124
124 -
 125
125 -
 126
126 -
 127
127 -
 128
128 -
 129
129 -
 130
130 -
 131
131 -
 132
132 -
 133
133 -
 134
134 -
 135
135 -
 136
136 -
 137
137 -
 138
138 -
 139
139 -
 140
140 -
 141
141 -
 142
142 -
 143
143 -
 144
144 -
 145
145 -
 146
146 -
 147
147 -
 148
148 -
 149
149 -
 150
150 -
 151
151 -
 152
152 -
 153
153 -
 154
154 -
 155
155 -
 156
156 -
 157
157 -
 158
158 -
 159
159 -
 160
160 -
 161
161 -
 162
162 -
 163
163 -
 164
164 -
 165
165 -
 166
166 -
 167
167 -
 168
168 -
 169
169 -
 170
170 -
 171
171 -
 172
172 -
 173
173 -
 174
174 -
 175
175 -
 176
176 -
 177
177 -
 178
178 -
 179
179 -
 180
180 -
 181
181 -
 182
182 -
 183
183 -
 184
184 -
 185
185 -
 186
186 -
 187
187 -
 188
188 -
 189
189 -
 190
190 -
 191
191 -
 192
192 -
 193
193 -
 194
194 -
 195
195 -
 196
196 -
 197
197 -
 198
198 -
 199
199 -
 200
200 -
 201
201 -
 202
202 -
 203
203 -
 204
204 -
 205
205 -
 206
206 -
 207
207 -
 208
208 -
 209
209 -
 210
210 -
 211
211 -
 212
212 -
 213
213 -
 214
214 -
 215
215 -
 216
216 -
 217
217 -
 218
218 -
 219
219 -
 220
220 -
 221
221 -
 222
222 -
 223
223 -
 224
224 -
 225
225 -
 226
226 -
 227
227 -
 228
228 -
 229
229 -
 230
230 -
 231
231 -
 232
232 -
 233
233 -
 234
234 -
 235
235 -
 236
236 -
 237
237 -
 238
238 -
 239
239 -
 240
240 -
 241
241 -
 242
242 -
 243
243 -
 244
244 -
 245
245 -
 246
246 -
 247
247 -
 248
248 -
 249
249 -
 250
250 -
 251
251 -
 252
252 -
 253
253 -
 254
254 -
 255
255 -
 256
256 -
 257
257 -
 258
258 -
 259
259 -
 260
260 -
 261
261 -
 262
262 -
 263
263 -
 264
264 -
 265
265 -
 266
266 -
 267
267 -
 268
268 -
 269
269 -
 270
270 -
 271
271 -
 272
272 -
 273
273 -
 274
274 -
 275
275 -
 276
276 -
 277
277 -
 278
278 -
 279
279 -
 280
280 -
 281
281 -
 282
282 -
 283
283 -
 284
284 -
 285
285 -
 286
286 -
 287
287 -
 288
288 -
 289
289 -
 290
290 -
 291
291 -
 292
292 -
 293
293 -
 294
294 -
 295
295 -
 296
296 -
 297
297 -
 298
298 -
 299
299 -
 300
300 -
 301
301 -
 302
302 -
 303
303 -
 304
304 -
 305
305 -
 306
306 -
 307
307 -
 308
308 -
 309
309 -
 310
310 -
 311
311 -
 312
312 -
 313
313 -
 314
314 -
 315
315 -
 316
316 -
 317
317 -
 318
318 -
 319
319 -
 320
320 -
 321
321 -
 322
322 -
 323
323 -
 324
324 -
 325
325 -
 326
326 -
 327
327 -
 328
328 -
 329
329 -
 330
330 -
 331
331 -
 332
332 -
 333
333 -
 334
334 -
 335
335 -
 336
336 -
 337
337 -
 338
338 -
 339
339 -
 340
340 -
 341
341 -
 342
342 -
 343
343 -
 344
344 -
 345
345 -
 346
346 -
 347
347 -
 348
348 -
 349
349 -
 350
350 -
 351
351 -
 352
352 -
 353
353 -
 354
354 -
 355
355 -
 356
356 -
 357
357 -
 358
358 -
 359
359 -
 360
360 -
 361
361 -
 362
362 -
 363
363 -
 364
364 -
 365
365 -
 366
366 -
 367
367 -
 368
368 -
 369
369 -
 370
370 -
 371
371 -
 372
372 -
 373
373 -
 374
374 -
 375
375 -
 376
376 -
 377
377 -
 378
378 -
 379
379 -
 380
380 -
 381
381 -
 382
382 -
 383
383 -
 384
384 -
 385
385 -
 386
386 -
 387
387 -
 388
388 -
 389
389 -
 390
390 -
 391
391 -
 392
392 -
 393
393 -
 394
394 -
 395
395 -
 396
396 -
 397
397 -
 398
398 -
 399
399 -
 400
400 -
 401
401 -
 402
402
 |
 |

67
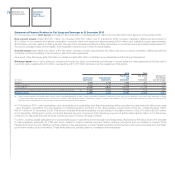
For light commercial vehicles, a total of 390,400 units were delivered, representing a 27.1% year-on-year increase. In Europe, Fiat Professional increased
deliveries 19.7% to 183,300 units. In Italy, Fiat Professional achieved a 44.0% market share, gaining approximately 3 percentage points over 2009, while
share in Europe was 12.8% (stable vs. 2009).
In Brazil, Fiat Group Automobiles maintained its leadership position, delivering a total of 761,400 passenger cars and light commercial vehicles,
representing a year-on-year increase of 1.6%. With the overall market growing 10.6%, FGA achieved a 22.8% share for the year (-1.7 percentage points).
For 2010, Maserati reported €586 million in revenues, an increase of 30.8% over 2009, primarily attributable to excellent sales performance for the
new GranCabrio. A total of 5,675 cars were delivered to the network during the year, an increase of 26.4%, with positive performance in the majority of
Maserati’s 59 national markets.
For 2010, Ferrari reported €1,919 million in revenues, up 7.9% over 2009, mainly reflecting higher sales volumes driven by the new 458 Italia and 599 GTO,
the continued success of the Ferrari California, as well as the positive contribution from the customization program. A total of 6,573 cars were delivered to
the network during the year (+5.4% over 2009).
Components and Production Systems
The Components and Production Systems businesses reported revenues of €10,865 million, a 23.6% increase driven primarily by volume growth in
all sectors.
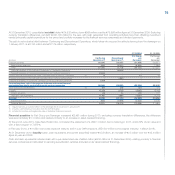
(€ million) 2010 2009 % change
Fiat Powertrain 4,211 3,372 24.9
Components (Magneti Marelli) 5,402 4,528 19.3
Metallurgical Products (Teksid) 776 578 34.3
Production Systems (Comau) 1,023 728 40.5
Eliminations (547) (417) -
Total 10,865 8,789 23.6
For 2010, Fiat Powertrain (the Passenger and Commercial Vehicles business line of the former FPT Powertrain Technologies sector) reported €4,211
million in revenues, an increase of 24.9% over the previous year. This includes the effect of full consolidation of Fiat Powertrain Polska Sp. z.o.o. (formerly
Fiat-GM Powertrain Polska) following acquisition of the JV partner’s 50% stake during the year. On a like-for-like basis, the increase in revenues was
11.1%. Sales to Fiat Group companies accounted for 87% of revenues (90% on a comparable scope of operations and 92% for 2009), with the remainder
primarily consisting of diesel engines sold to external customers. A total of 2,347,000 engines (+2.5% on a like-for-like basis) and 2,233,000 transmissions
(+1.1%) were sold during the year.
Magneti Marelli reported 2010 revenues of €5,402 million, representing a 19.3% increase over 2009. For Europe overall, the increase reflected strong
performance for light commercial vehicles and recovery in the medium-large passenger car segments, which were particularly hard hit in 2009. In Italy and
Poland, revenues reflected the overall decline for A and B-segment cars following the elimination of government eco-incentives. The sector experienced
strong performance in both China and Brazil and a significant recovery in the NAFTA region, where volume growth was primarily driven by new product
launches.
All business lines recorded an increase in production volumes. The Lighting business achieved significant growth linked to the recovery of its core
European markets and volume increases in Asian markets and the NAFTA region. The Suspension Systems business also saw a strong recovery,
with volume increases primarily concentrated in Brazil and the USA. Sales for Electronics Systems were up in China and Brazil, and the Engine Control
business also benefited significantly from performance in those markets.
Teksid reported revenues of €776 million for 2010, up 34.3% principally due to an increase over 2009 volumes, which were severely impacted by the
market crisis. The Cast Iron business unit recorded a 21.8% increase in volumes, driven primarily by growth in components for heavy vehicles, with positive
performance in the Mercosur and NAFTA regions, as well as in Europe. Volumes for the Aluminum business unit were up 15.3%.
Comau had revenues of €1,023 million for 2010, with the 40.5% increase over 2009 principally attributable to operations in China, Latin America and North
America.
