Chrysler 2010 Annual Report Download - page 75
Download and view the complete annual report
Please find page 75 of the 2010 Chrysler annual report below. You can navigate through the pages in the report by either clicking on the pages listed below, or by using the keyword search tool below to find specific information within the annual report.-
 1
1 -
2
-
3
-
4
-
5
-
6
-
7
-
8
-
9
-
10
-
11
-
12
-
13
-
14
-
15
-
16
-
17
-
18
-
19
-
20
-
21
-
22
-
23
-
24
-
25
-
26
-
27
-
28
-
29
-
30
-
31
-
32
-
33
-
34
-
35
-
36
-
37
-
38
-
39
-
40
-
41
-
42
-
43
-
44
-
45
-
46
-
47
-
48
-
49
-
50
-
51
-
52
-
53
-
54
-
55
-
56
-
57
-
58
-
59
-
60
-
61
-
62
-
63
-
64
-
 65
65 -
 66
66 -
 67
67 -
 68
68 -
 69
69 -
 70
70 -
 71
71 -
 72
72 -
 73
73 -
 74
74 -
 75
75 -
 76
76 -
 77
77 -
 78
78 -
 79
79 -
 80
80 -
 81
81 -
 82
82 -
 83
83 -
 84
84 -
 85
85 -
86
-
87
-
88
-
89
-
90
-
91
-
92
-
93
-
94
-
95
-
96
-
97
-
98
-
99
-
100
-
101
-
102
-
103
-
104
-
105
-
106
-
107
-
108
-
109
-
110
-
111
-
112
-
113
-
114
-
115
-
116
-
117
-
118
-
119
-
120
-
121
-
122
-
123
-
124
-
125
-
126
-
127
-
128
-
129
-
130
-
131
-
132
-
133
-
134
-
135
-
136
-
137
-
138
-
139
-
140
-
141
-
142
-
143
-
144
-
145
-
146
-
147
-
148
-
149
-
150
-
151
-
152
-
153
-
154
-
155
-
156
-
157
-
158
-
159
-
160
-
161
-
162
-
163
-
164
-
165
-
166
-
167
-
168
-
169
-
170
-
171
-
172
-
173
-
174
-
175
-
176
-
177
-
178
-
179
-
180
-
181
-
182
-
183
-
184
-
185
-
186
-
187
-
188
-
189
-
190
-
191
-
192
-
193
-
194
-
195
-
196
-
197
-
198
-
199
-
200
-
201
-
202
-
203
-
204
-
205
-
206
-
207
-
208
-
209
-
210
-
211
-
212
-
213
-
214
-
215
-
216
-
217
-
218
-
219
-
220
-
221
-
222
-
223
-
224
-
225
-
226
-
227
-
228
-
229
-
230
-
231
-
232
-
233
-
234
-
235
-
236
-
237
-
238
-
239
-
240
-
241
-
242
-
243
-
244
-
245
-
246
-
247
-
248
-
249
-
250
-
251
-
252
-
253
-
254
-
255
-
256
-
257
-
258
-
259
-
260
-
261
-
262
-
263
-
264
-
265
-
266
-
267
-
268
-
269
-
270
-
271
-
272
-
273
-
274
-
275
-
276
-
277
-
278
-
279
-
280
-
281
-
282
-
283
-
284
-
285
-
286
-
287
-
288
-
289
-
290
-
291
-
292
-
293
-
294
-
295
-
296
-
297
-
298
-
299
-
300
-
301
-
302
-
303
-
304
-
305
-
306
-
307
-
308
-
309
-
310
-
311
-
312
-
313
-
314
-
315
-
316
-
317
-
318
-
319
-
320
-
321
-
322
-
323
-
324
-
325
-
326
-
327
-
328
-
329
-
330
-
331
-
332
-
333
-
334
-
335
-
336
-
337
-
338
-
339
-
340
-
341
-
342
-
343
-
344
-
345
-
346
-
347
-
348
-
349
-
350
-
351
-
352
-
353
-
354
-
355
-
356
-
357
-
358
-
359
-
360
-
361
-
362
-
363
-
364
-
365
-
366
-
367
-
368
-
369
-
370
-
371
-
372
-
373
-
374
-
375
-
376
-
377
-
378
-
379
-
380
-
381
-
382
-
383
-
384
-
385
-
386
-
387
-
388
-
389
-
390
-
391
-
392
-
393
-
394
-
395
-
396
-
397
-
398
-
399
-
400
-
401
-
402
 |
 |

REPORT ON
OPERATIONS
FINANCIAL
REVIEW –
FIAT GROUP
74
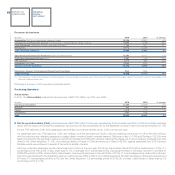
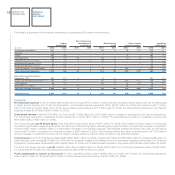
Statement of Financial Position for Fiat Group pre Demerger at 31 December 2010
At 31 December 2010, total assets amounted to €73,442 million, increasing €6,207 million from the €67,235 million figure at 31 December 2009.
Non-current assets totaled €27,331 million, an increase of €1,847 million over 31 December 2009. Currency translation differences accounted for
€0.9 billion of the increase and related principally to property, plant and equipment (approximately €400 million) and intangible assets (approximately
€260 million, primarily related to CNH goodwill). The rest of the increase was almost entirely attributable to investments and amortization/depreciation for
the period, increased deferred tax assets, and increased investments and other financial assets.
Current assets totaled €46,032 million, a €4,363 million increase of which approximately €2 billion was due to currency translation differences with the
remainder primarily consisting of an increase in cash and cash equivalents.
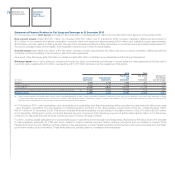
As a result of the Demerger, €34,786 million in assets and €29,920 million in liabilities were reclassified as Discontinued Operations.
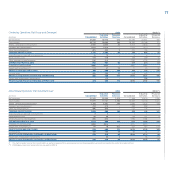
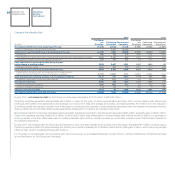
Working capital (net of items relating to vehicles sold under buy-back commitments and vehicles no longer subject to lease agreements that are held in
inventory) was a negative €3,391 million, representing a €1,727 million decrease over the beginning of the period.
2010 2009
Fiat Group Fiat Group Change for
Continuing Discontinued pre pre Fiat Group
(€ million) Operations Operations Demerger Demerger pre Demerger
Inventory 3,806 3,739 7,545 7,887 -342
Trade receivables 2,259 1,791 4,050 3,649 401
Trade payables (9,345) (3,906) (13,251) (12,295) -956
Current taxes receivable/(payable) & Other current receivables/(payables) (a) (1,386) (349) (1,735) (905) -830
Working capital (4,666) 1,275 (3,391) (1,664) -1,727
(a) Other current payables, included under current taxes receivable/(payable) & other current receivables/(payables), exclude the buy-back price payable to customers upon expiration of lease
contracts and advanced payments from customers for vehicles sold under buy-back commitments, which is equal to the difference, at the contract date, between the initial sale price and the
buy-back price. Recognition of such amounts is apportioned over the life of the contract
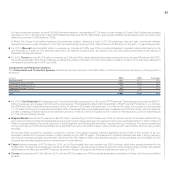
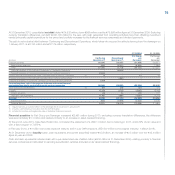
At 31 December 2010, trade receivables, other receivables and receivables from financing activities falling due after that date and sold without recourse
– and, therefore, eliminated from the statement of financial position pursuant to the derecognition requirements of IAS 39 – totaled €4,624 million
(€4,611 million at 31 December 2009). This amount includes financial receivables, mostly relating to the sales network, of €2,376 million (€2,530 million
at 31 December 2009) sold to jointly-controlled financial services companies (FGA Capital group) and of €409 million (€440 million at 31 December
2009) sold to associate financial services companies (Iveco Finance Holdings Limited).
For 2010, working capital (calculated on a comparable scope of operations and at constant exchange rates) decreased by €2 billion due to the increase
in trade payables, principally for CNH and Iveco, related to higher business volumes, further inventory reductions and an increase in Current Taxes
Payable and Other Current Liabilities, primarily relating to the assessment of current taxation and the reimbursement of amounts receivable from the Italian
government relating to eco-incentives. These items were only partially offset by increased trade receivables.