Chrysler 2010 Annual Report Download - page 27
Download and view the complete annual report
Please find page 27 of the 2010 Chrysler annual report below. You can navigate through the pages in the report by either clicking on the pages listed below, or by using the keyword search tool below to find specific information within the annual report.-
 1
1 -
2
-
3
-
4
-
5
-
6
-
7
-
8
-
9
-
10
-
11
-
12
-
13
-
14
-
15
-
16
-
 17
17 -
 18
18 -
 19
19 -
 20
20 -
 21
21 -
 22
22 -
 23
23 -
 24
24 -
 25
25 -
 26
26 -
 27
27 -
 28
28 -
 29
29 -
 30
30 -
 31
31 -
 32
32 -
 33
33 -
 34
34 -
 35
35 -
 36
36 -
 37
37 -
38
-
39
-
40
-
41
-
42
-
43
-
44
-
45
-
46
-
47
-
48
-
49
-
50
-
51
-
52
-
53
-
54
-
55
-
56
-
57
-
58
-
59
-
60
-
61
-
62
-
63
-
64
-
65
-
66
-
67
-
68
-
69
-
70
-
71
-
72
-
73
-
74
-
75
-
76
-
77
-
78
-
79
-
80
-
81
-
82
-
83
-
84
-
85
-
86
-
87
-
88
-
89
-
90
-
91
-
92
-
93
-
94
-
95
-
96
-
97
-
98
-
99
-
100
-
101
-
102
-
103
-
104
-
105
-
106
-
107
-
108
-
109
-
110
-
111
-
112
-
113
-
114
-
115
-
116
-
117
-
118
-
119
-
120
-
121
-
122
-
123
-
124
-
125
-
126
-
127
-
128
-
129
-
130
-
131
-
132
-
133
-
134
-
135
-
136
-
137
-
138
-
139
-
140
-
141
-
142
-
143
-
144
-
145
-
146
-
147
-
148
-
149
-
150
-
151
-
152
-
153
-
154
-
155
-
156
-
157
-
158
-
159
-
160
-
161
-
162
-
163
-
164
-
165
-
166
-
167
-
168
-
169
-
170
-
171
-
172
-
173
-
174
-
175
-
176
-
177
-
178
-
179
-
180
-
181
-
182
-
183
-
184
-
185
-
186
-
187
-
188
-
189
-
190
-
191
-
192
-
193
-
194
-
195
-
196
-
197
-
198
-
199
-
200
-
201
-
202
-
203
-
204
-
205
-
206
-
207
-
208
-
209
-
210
-
211
-
212
-
213
-
214
-
215
-
216
-
217
-
218
-
219
-
220
-
221
-
222
-
223
-
224
-
225
-
226
-
227
-
228
-
229
-
230
-
231
-
232
-
233
-
234
-
235
-
236
-
237
-
238
-
239
-
240
-
241
-
242
-
243
-
244
-
245
-
246
-
247
-
248
-
249
-
250
-
251
-
252
-
253
-
254
-
255
-
256
-
257
-
258
-
259
-
260
-
261
-
262
-
263
-
264
-
265
-
266
-
267
-
268
-
269
-
270
-
271
-
272
-
273
-
274
-
275
-
276
-
277
-
278
-
279
-
280
-
281
-
282
-
283
-
284
-
285
-
286
-
287
-
288
-
289
-
290
-
291
-
292
-
293
-
294
-
295
-
296
-
297
-
298
-
299
-
300
-
301
-
302
-
303
-
304
-
305
-
306
-
307
-
308
-
309
-
310
-
311
-
312
-
313
-
314
-
315
-
316
-
317
-
318
-
319
-
320
-
321
-
322
-
323
-
324
-
325
-
326
-
327
-
328
-
329
-
330
-
331
-
332
-
333
-
334
-
335
-
336
-
337
-
338
-
339
-
340
-
341
-
342
-
343
-
344
-
345
-
346
-
347
-
348
-
349
-
350
-
351
-
352
-
353
-
354
-
355
-
356
-
357
-
358
-
359
-
360
-
361
-
362
-
363
-
364
-
365
-
366
-
367
-
368
-
369
-
370
-
371
-
372
-
373
-
374
-
375
-
376
-
377
-
378
-
379
-
380
-
381
-
382
-
383
-
384
-
385
-
386
-
387
-
388
-
389
-
390
-
391
-
392
-
393
-
394
-
395
-
396
-
397
-
398
-
399
-
400
-
401
-
402
 |
 |

REPORT ON
OPERATIONS
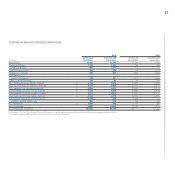
HIGHLIGHTS
26
(€ million) 2010 2009 2008 2007
Net revenues 56,258 50,102 59,564(*) 58,529
Trading profit/(loss) 2,204 1,058 3,362 3,233
Operating profit/(loss) 2,009 359 2,972 3,152
Profit/(loss) before taxes 1,282 (367) 2,187 2,773
Profit/(loss) for the year 600 (848) 1,721 2,054
Attributable to:
Owners of the parent 520 (838) 1,612 1,953
Non-controlling interests 80 (10) 109 101
Basic earnings/(loss) per ordinary share (€) (1) 0.410 (0.677) 1.290 1.537
Basic earnings/(loss) per preference share (€) (1) 0.410 (0.677) 1.290 1.537
Basic earnings/(loss) per savings share (€) (1) 0.565 (0.677) 1.445 1.692
Diluted earnings/(loss) per ordinary share (€) (1) 0.409 (0.677) 1.285 1.526
Diluted earnings/(loss) per preference share (€) (1) 0.409 (0.677) 1.285 1.526
Diluted earnings/(loss) per savings share (€) (1) 0.564 (0.677) 1.440 1.681
Investments in tangible and intangible assets 3,718 3,386 4,979(*) 3,985
of which: capitalized R&D costs 1,282 1,046 1,216 932
R&D expenditure (2) 1,936 1,692 1,986 1,741
Total assets 73,442 67,235 61,772 60,136
Net (debt)/cash (14,932) (15,898) (17,954) (10,423)
of which: net industrial (debt)/cash (2,442) (4,418) (5,949) 355
Total equity 12,461 11,115 11,101 11,279
Equity attributable to owners of the parent 11,544 10,301 10,354 10,606
No. of employees at year end 199,924 190,014 198,348 185,227
(*) Following adoption of the improvement to IAS 16 in 2009, revenues for 2008 were increased by €184 million and investments in tangible and intangible assets were reduced by €284 million
(1) See Note 13 to the Consolidated Financial Statements for additional information on the calculation of basic and diluted earnings per share
(2) Includes capitalized R&D and R&D charged directly to the income statement
HIGHLIGHTS
FIAT GROUP PRE DEMERGER