Chrysler 2010 Annual Report Download - page 239
Download and view the complete annual report
Please find page 239 of the 2010 Chrysler annual report below. You can navigate through the pages in the report by either clicking on the pages listed below, or by using the keyword search tool below to find specific information within the annual report.-
 1
1 -
2
-
3
-
4
-
5
-
6
-
7
-
8
-
9
-
10
-
11
-
12
-
13
-
14
-
15
-
16
-
17
-
18
-
19
-
20
-
21
-
22
-
23
-
24
-
25
-
26
-
27
-
28
-
29
-
30
-
31
-
32
-
33
-
34
-
35
-
36
-
37
-
38
-
39
-
40
-
41
-
42
-
43
-
44
-
45
-
46
-
47
-
48
-
49
-
50
-
51
-
52
-
53
-
54
-
55
-
56
-
57
-
58
-
59
-
60
-
61
-
62
-
63
-
64
-
65
-
66
-
67
-
68
-
69
-
70
-
71
-
72
-
73
-
74
-
75
-
76
-
77
-
78
-
79
-
80
-
81
-
82
-
83
-
84
-
85
-
86
-
87
-
88
-
89
-
90
-
91
-
92
-
93
-
94
-
95
-
96
-
97
-
98
-
99
-
100
-
101
-
102
-
103
-
104
-
105
-
106
-
107
-
108
-
109
-
110
-
111
-
112
-
113
-
114
-
115
-
116
-
117
-
118
-
119
-
120
-
121
-
122
-
123
-
124
-
125
-
126
-
127
-
128
-
129
-
130
-
131
-
132
-
133
-
134
-
135
-
136
-
137
-
138
-
139
-
140
-
141
-
142
-
143
-
144
-
145
-
146
-
147
-
148
-
149
-
150
-
151
-
152
-
153
-
154
-
155
-
156
-
157
-
158
-
159
-
160
-
161
-
162
-
163
-
164
-
165
-
166
-
167
-
168
-
169
-
170
-
171
-
172
-
173
-
174
-
175
-
176
-
177
-
178
-
179
-
180
-
181
-
182
-
183
-
184
-
185
-
186
-
187
-
188
-
189
-
190
-
191
-
192
-
193
-
194
-
195
-
196
-
197
-
198
-
199
-
200
-
201
-
202
-
203
-
204
-
205
-
206
-
207
-
208
-
209
-
210
-
211
-
212
-
213
-
214
-
215
-
216
-
217
-
218
-
219
-
220
-
221
-
222
-
223
-
224
-
225
-
226
-
227
-
228
-
 229
229 -
 230
230 -
 231
231 -
 232
232 -
 233
233 -
 234
234 -
 235
235 -
 236
236 -
 237
237 -
 238
238 -
 239
239 -
 240
240 -
 241
241 -
 242
242 -
 243
243 -
 244
244 -
 245
245 -
 246
246 -
 247
247 -
 248
248 -
 249
249 -
250
-
251
-
252
-
253
-
254
-
255
-
256
-
257
-
258
-
259
-
260
-
261
-
262
-
263
-
264
-
265
-
266
-
267
-
268
-
269
-
270
-
271
-
272
-
273
-
274
-
275
-
276
-
277
-
278
-
279
-
280
-
281
-
282
-
283
-
284
-
285
-
286
-
287
-
288
-
289
-
290
-
291
-
292
-
293
-
294
-
295
-
296
-
297
-
298
-
299
-
300
-
301
-
302
-
303
-
304
-
305
-
306
-
307
-
308
-
309
-
310
-
311
-
312
-
313
-
314
-
315
-
316
-
317
-
318
-
319
-
320
-
321
-
322
-
323
-
324
-
325
-
326
-
327
-
328
-
329
-
330
-
331
-
332
-
333
-
334
-
335
-
336
-
337
-
338
-
339
-
340
-
341
-
342
-
343
-
344
-
345
-
346
-
347
-
348
-
349
-
350
-
351
-
352
-
353
-
354
-
355
-
356
-
357
-
358
-
359
-
360
-
361
-
362
-
363
-
364
-
365
-
366
-
367
-
368
-
369
-
370
-
371
-
372
-
373
-
374
-
375
-
376
-
377
-
378
-
379
-
380
-
381
-
382
-
383
-
384
-
385
-
386
-
387
-
388
-
389
-
390
-
391
-
392
-
393
-
394
-
395
-
396
-
397
-
398
-
399
-
400
-
401
-
402
 |
 |

FIAT GROUP
CONSOLIDATED
FINANCIAL
STATEMENTS
AT 31 DECEMBER
2010
NOTES
238
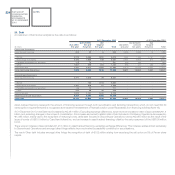
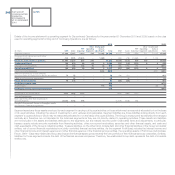
At 31 December 2010 the Group had outstanding financial lease agreements for certain property, plant and equipment whose overall net carrying amount
totalling €322 million is included in Continuing Operations (Note 15). At 31 December 2010, the Group had outstanding financial lease agreements for certain
Property, plant and equipment whose net carrying amount totalling €48 million is included in Discontinued Operations. At 31 December 2009, the Group
had outstanding financial lease agreements for certain Property, plant and equipment whose net carrying amount was €304 million.
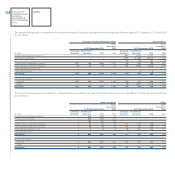
At 31 December 2010, payables for finance leases included in Other debt and classified as Continuing Operations and as Discontinued Operations amount
to €286 million and €45 million, respectively, and may be analysed as follows:
Continuing Operations Discontinued Operations
due between due due between due
due within one and beyond due within one and beyond
(€ million) one year five years five years Total one year five years five years Total
Minimum future lease payments 48 113 129 290 8 19 20 47
Interest expense (1) (3) - (4) (1) (1) - (2)
Present value of minimum lease payments 47 110 129 286 7 18 20 45
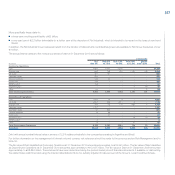
At 31 December 2009, Payables for finance leases included in Other debt amounted to €268 million and may be analysed as follows:
At 31 December 2009
due between due
due within one ands beyond
(€ million) one year five year five years Total
Minimum future lease payments 47 105 119 271
Interest expense (1) (2) - (3)
Present value of minimum lease payments 46 103 119 268
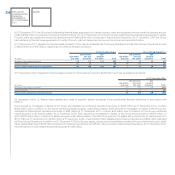
As discussed in Note 15, finance lease payables also relate to suppliers’ assets recognised in the consolidated financial statements in accordance with
IFRIC 4.
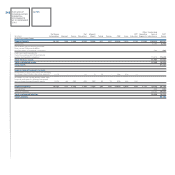
Debt secured by mortgages on assets of the Group and classified as Continuing Operations amounts to €324 million at 31 December 2010, of which
€286 million due to creditors for the above mentioned assets acquired under finance leases. Debt secured by mortgages on assets of the Group and
classified as Discontinued Operations amounts to €88 million at 31 December 2010, of which €45 million due to creditors for the above mentioned
assets acquired under finance leases. At 31 December 2009, Debt secured by mortgages on assets of the Group and amounted to €358 million, of
which €268 million due to creditors for assets acquired under finance leases. The total carrying amount of assets acting as security for loans amounts to
€517 million at 31 December 2010 (€446 million at 31 December 2009), of which €425 million classified as Continuing Operations and €92 million classified
as Discontinued Operations. In addition, at 31 December 2010 the Group’s assets include current receivables and cash with a pre-determined use to settle
Asset-backed financing of €533 million included in Continuing Operations and of €8,321 million included in Discontinued Operations. At 31 December 2009,
the total amount of such Asset-backed financing was €7,086 million.