Chrysler 2010 Annual Report Download - page 101
Download and view the complete annual report
Please find page 101 of the 2010 Chrysler annual report below. You can navigate through the pages in the report by either clicking on the pages listed below, or by using the keyword search tool below to find specific information within the annual report.-
 1
1 -
2
-
3
-
4
-
5
-
6
-
7
-
8
-
9
-
10
-
11
-
12
-
13
-
14
-
15
-
16
-
17
-
18
-
19
-
20
-
21
-
22
-
23
-
24
-
25
-
26
-
27
-
28
-
29
-
30
-
31
-
32
-
33
-
34
-
35
-
36
-
37
-
38
-
39
-
40
-
41
-
42
-
43
-
44
-
45
-
46
-
47
-
48
-
49
-
50
-
51
-
52
-
53
-
54
-
55
-
56
-
57
-
58
-
59
-
60
-
61
-
62
-
63
-
64
-
65
-
66
-
67
-
68
-
69
-
70
-
71
-
72
-
73
-
74
-
75
-
76
-
77
-
78
-
79
-
80
-
81
-
82
-
83
-
84
-
85
-
86
-
87
-
88
-
89
-
90
-
 91
91 -
 92
92 -
 93
93 -
 94
94 -
 95
95 -
 96
96 -
 97
97 -
 98
98 -
 99
99 -
 100
100 -
 101
101 -
 102
102 -
 103
103 -
 104
104 -
 105
105 -
 106
106 -
 107
107 -
 108
108 -
 109
109 -
 110
110 -
 111
111 -
112
-
113
-
114
-
115
-
116
-
117
-
118
-
119
-
120
-
121
-
122
-
123
-
124
-
125
-
126
-
127
-
128
-
129
-
130
-
131
-
132
-
133
-
134
-
135
-
136
-
137
-
138
-
139
-
140
-
141
-
142
-
143
-
144
-
145
-
146
-
147
-
148
-
149
-
150
-
151
-
152
-
153
-
154
-
155
-
156
-
157
-
158
-
159
-
160
-
161
-
162
-
163
-
164
-
165
-
166
-
167
-
168
-
169
-
170
-
171
-
172
-
173
-
174
-
175
-
176
-
177
-
178
-
179
-
180
-
181
-
182
-
183
-
184
-
185
-
186
-
187
-
188
-
189
-
190
-
191
-
192
-
193
-
194
-
195
-
196
-
197
-
198
-
199
-
200
-
201
-
202
-
203
-
204
-
205
-
206
-
207
-
208
-
209
-
210
-
211
-
212
-
213
-
214
-
215
-
216
-
217
-
218
-
219
-
220
-
221
-
222
-
223
-
224
-
225
-
226
-
227
-
228
-
229
-
230
-
231
-
232
-
233
-
234
-
235
-
236
-
237
-
238
-
239
-
240
-
241
-
242
-
243
-
244
-
245
-
246
-
247
-
248
-
249
-
250
-
251
-
252
-
253
-
254
-
255
-
256
-
257
-
258
-
259
-
260
-
261
-
262
-
263
-
264
-
265
-
266
-
267
-
268
-
269
-
270
-
271
-
272
-
273
-
274
-
275
-
276
-
277
-
278
-
279
-
280
-
281
-
282
-
283
-
284
-
285
-
286
-
287
-
288
-
289
-
290
-
291
-
292
-
293
-
294
-
295
-
296
-
297
-
298
-
299
-
300
-
301
-
302
-
303
-
304
-
305
-
306
-
307
-
308
-
309
-
310
-
311
-
312
-
313
-
314
-
315
-
316
-
317
-
318
-
319
-
320
-
321
-
322
-
323
-
324
-
325
-
326
-
327
-
328
-
329
-
330
-
331
-
332
-
333
-
334
-
335
-
336
-
337
-
338
-
339
-
340
-
341
-
342
-
343
-
344
-
345
-
346
-
347
-
348
-
349
-
350
-
351
-
352
-
353
-
354
-
355
-
356
-
357
-
358
-
359
-
360
-
361
-
362
-
363
-
364
-
365
-
366
-
367
-
368
-
369
-
370
-
371
-
372
-
373
-
374
-
375
-
376
-
377
-
378
-
379
-
380
-
381
-
382
-
383
-
384
-
385
-
386
-
387
-
388
-
389
-
390
-
391
-
392
-
393
-
394
-
395
-
396
-
397
-
398
-
399
-
400
-
401
-
402
 |
 |

REPORT ON
OPERATIONS
OPERATING
PERFORMANCE:
CONTINUING
OPERATIONS
100100
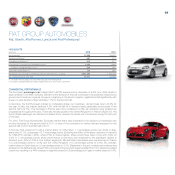
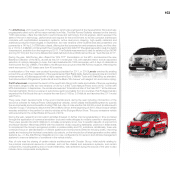
The Fiat brand’s market share decreased to 6.0% in Europe (-1.0 percentage point over 2009) and the Fiat
Panda and Fiat 500 retained the top two positions in the A segment, with the latter achieving a net share gain
of 2.5 percentage points. The Lancia brand’s European market share was 0.7% (-0.1 percentage points), while
Alfa Romeo maintained registration levels steady (with a 0.8% share), despite the contraction in the market, due
to the positive contribution of the new Giulietta in the second half.
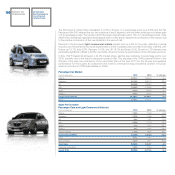
Demand in the European light commercial vehicle market was up 9.2% for the year, reflecting a partial
recovery over the extremely low levels experienced in 2009. Increases were recorded in all major markets, with
France up 10.7%, Italy 6.2%, Germany 14.0%, the UK 18.7% and Spain 9.5%. Growth in LCV demand was
particularly significant in Brazil (+29.5% over 2009), driven by the strong performance of the domestic economy.
In Italy, Fiat Professional achieved a 44.0% market share, gaining approximately 3 percentage points over
2009, primarily due to the brand’s expanded product offer. The success of the CNG-powered Fiorino in the
first part of the year, the contribution of the new Doblò (Van of the Year 2011) for the full year and excellent
performance for the Ducato all underpinned the brand’s continued strong competitive position in Europe,
where it recorded a 12.8% share (stable vs. 2009).
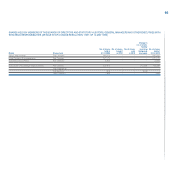
Passenger Car Market
(units in thousands) 2010 2009 % change
France 2,251.7 2,302.4 -2.2
Germany 2,916.3 3,807.2 -23.4
UK 2,030.8 1,995.0 1.8
Italy 1,960.3 2,159.5 -9.2
Spain 982.0 952.8 3.1
Poland 333.5 320.3 4.1
Europe (EU27+EFTA) 13,785.7 14,499.1 -4.9
Brazil 2,695.4 2,520.2 6.9
Sales Performance
Passenger Cars and Light Commercial Vehicles
(units in thousands) 2010 2009 % change
France 120.9 114.8 5.3
Germany 107.8 179.5 -39.9
UK 66.4 75.1 -11.5
Italy 625.6 721.9 -13.3
Spain 37.3 25.2 48.1
Poland 34.7 42.4 -18.3
Rest of Europe 172.8 145.6 18.7
Europe (EU27+EFTA) 1,165.5 1,304.5 -10.7
Brazil 761.4 749.5 1.6
Rest of World 154.9 96.7 60.3
Total Sales 2,081.8 2,150.7 -3.2
Associate companies 140.5 126.9 10.6
Grand Total 2,222.3 2,277.6 -2.4