Chrysler 2010 Annual Report Download - page 225
Download and view the complete annual report
Please find page 225 of the 2010 Chrysler annual report below. You can navigate through the pages in the report by either clicking on the pages listed below, or by using the keyword search tool below to find specific information within the annual report.-
 1
1 -
2
-
3
-
4
-
5
-
6
-
7
-
8
-
9
-
10
-
11
-
12
-
13
-
14
-
15
-
16
-
17
-
18
-
19
-
20
-
21
-
22
-
23
-
24
-
25
-
26
-
27
-
28
-
29
-
30
-
31
-
32
-
33
-
34
-
35
-
36
-
37
-
38
-
39
-
40
-
41
-
42
-
43
-
44
-
45
-
46
-
47
-
48
-
49
-
50
-
51
-
52
-
53
-
54
-
55
-
56
-
57
-
58
-
59
-
60
-
61
-
62
-
63
-
64
-
65
-
66
-
67
-
68
-
69
-
70
-
71
-
72
-
73
-
74
-
75
-
76
-
77
-
78
-
79
-
80
-
81
-
82
-
83
-
84
-
85
-
86
-
87
-
88
-
89
-
90
-
91
-
92
-
93
-
94
-
95
-
96
-
97
-
98
-
99
-
100
-
101
-
102
-
103
-
104
-
105
-
106
-
107
-
108
-
109
-
110
-
111
-
112
-
113
-
114
-
115
-
116
-
117
-
118
-
119
-
120
-
121
-
122
-
123
-
124
-
125
-
126
-
127
-
128
-
129
-
130
-
131
-
132
-
133
-
134
-
135
-
136
-
137
-
138
-
139
-
140
-
141
-
142
-
143
-
144
-
145
-
146
-
147
-
148
-
149
-
150
-
151
-
152
-
153
-
154
-
155
-
156
-
157
-
158
-
159
-
160
-
161
-
162
-
163
-
164
-
165
-
166
-
167
-
168
-
169
-
170
-
171
-
172
-
173
-
174
-
175
-
176
-
177
-
178
-
179
-
180
-
181
-
182
-
183
-
184
-
185
-
186
-
187
-
188
-
189
-
190
-
191
-
192
-
193
-
194
-
195
-
196
-
197
-
198
-
199
-
200
-
201
-
202
-
203
-
204
-
205
-
206
-
207
-
208
-
209
-
210
-
211
-
212
-
213
-
214
-
 215
215 -
 216
216 -
 217
217 -
 218
218 -
 219
219 -
 220
220 -
 221
221 -
 222
222 -
 223
223 -
 224
224 -
 225
225 -
 226
226 -
 227
227 -
 228
228 -
 229
229 -
 230
230 -
 231
231 -
 232
232 -
 233
233 -
 234
234 -
 235
235 -
236
-
237
-
238
-
239
-
240
-
241
-
242
-
243
-
244
-
245
-
246
-
247
-
248
-
249
-
250
-
251
-
252
-
253
-
254
-
255
-
256
-
257
-
258
-
259
-
260
-
261
-
262
-
263
-
264
-
265
-
266
-
267
-
268
-
269
-
270
-
271
-
272
-
273
-
274
-
275
-
276
-
277
-
278
-
279
-
280
-
281
-
282
-
283
-
284
-
285
-
286
-
287
-
288
-
289
-
290
-
291
-
292
-
293
-
294
-
295
-
296
-
297
-
298
-
299
-
300
-
301
-
302
-
303
-
304
-
305
-
306
-
307
-
308
-
309
-
310
-
311
-
312
-
313
-
314
-
315
-
316
-
317
-
318
-
319
-
320
-
321
-
322
-
323
-
324
-
325
-
326
-
327
-
328
-
329
-
330
-
331
-
332
-
333
-
334
-
335
-
336
-
337
-
338
-
339
-
340
-
341
-
342
-
343
-
344
-
345
-
346
-
347
-
348
-
349
-
350
-
351
-
352
-
353
-
354
-
355
-
356
-
357
-
358
-
359
-
360
-
361
-
362
-
363
-
364
-
365
-
366
-
367
-
368
-
369
-
370
-
371
-
372
-
373
-
374
-
375
-
376
-
377
-
378
-
379
-
380
-
381
-
382
-
383
-
384
-
385
-
386
-
387
-
388
-
389
-
390
-
391
-
392
-
393
-
394
-
395
-
396
-
397
-
398
-
399
-
400
-
401
-
402
 |
 |

FIAT GROUP
CONSOLIDATED
FINANCIAL
STATEMENTS
AT 31 DECEMBER
2010
NOTES
224
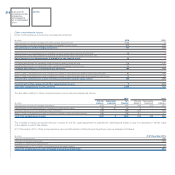
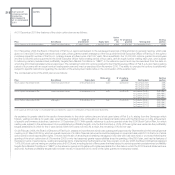
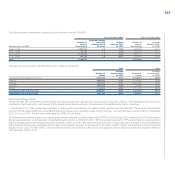
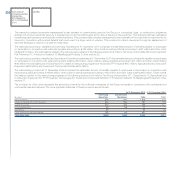
The following table reflects performance-based share activity under the CNH EIP:
2010 2009
Weighted Weighted
average grant average grant
Number of date fair value Number of date fair value
shares (in USD) shares (in USD)
Non-vested at the beginning of the year 1,349,000 31.22 1,870,500 31.28
Granted 2,027,000 34.74 25,000 11.83
Forfeited (1,359,000) 31.25 (546,500) 30.52
Vested - - - -
Non-vested at the end of the year 2,017,000 34.74 1,349,000 31.22
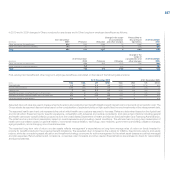
Restricted Share Grants
In September 2010, CNH granted 302,000 restricted share awards to selected key employees under the CNH EIP. Restricted shares vest in three equal
instalments over a three-year period ending 30 September 2013. The fair value of this award is US$34.74
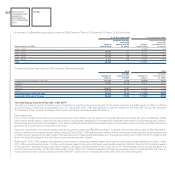
The following table reflects restricted share activity under the CNH EIP:
2010
Weighted average
grant date
Number of shares fair value (in USD)
Non-vested at the beginning of the year - -
Granted 326,000 34.56
Forfeited (2,000) 34.74
Vested (8,000) 32.35
Non-vested at the end of the year 316,000 34.62
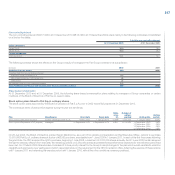
As of 31 December 2010, there were 4,992,271 CNH Global N.V. common shares (8,332,115 CNH Global N.V. common shares at 31 December 2009)
available for issue under the CNH EIP.
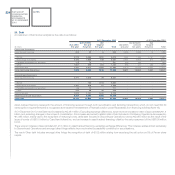
The Black-Scholes pricing model was used to calculate the fair value of stock options by the CNH – Case New Holland sector. The weighted-average
assumptions used under the Black-Scholes pricing model were as follows:
2010 2009
Directors’ Equity
Directors’ Equity
Plan Incentive Plan Plan Incentive Plan
Option life (years) 5.00 3.73 5.00 3.73
Price volatility of CNH Global N.V. shares (%) 66.9 74.1 62.9 70.6
Expected dividend yield (%) 0.6 0.5 0.8 0.7
Risk-free interest rate (%) 2.0 1.9 2.2 1.6
Based on this model, the weighted-average fair values of stock options awarded by CNH for the years ended 31 December 2010 and 2009 were as follows:
(in USD) 2010 2009
Directors’ Plan 14.60 8.03
Equity incentive plan 16.10 9.03
The total cost recognised in the 2010 income statement for all share-based compensation linked to CNH Global N.V. ordinary shares amounts to €26 million
(€10 million in 2009).