Chrysler 2010 Annual Report Download - page 330
Download and view the complete annual report
Please find page 330 of the 2010 Chrysler annual report below. You can navigate through the pages in the report by either clicking on the pages listed below, or by using the keyword search tool below to find specific information within the annual report.-
 1
1 -
2
-
3
-
4
-
5
-
6
-
7
-
8
-
9
-
10
-
11
-
12
-
13
-
14
-
15
-
16
-
17
-
18
-
19
-
20
-
21
-
22
-
23
-
24
-
25
-
26
-
27
-
28
-
29
-
30
-
31
-
32
-
33
-
34
-
35
-
36
-
37
-
38
-
39
-
40
-
41
-
42
-
43
-
44
-
45
-
46
-
47
-
48
-
49
-
50
-
51
-
52
-
53
-
54
-
55
-
56
-
57
-
58
-
59
-
60
-
61
-
62
-
63
-
64
-
65
-
66
-
67
-
68
-
69
-
70
-
71
-
72
-
73
-
74
-
75
-
76
-
77
-
78
-
79
-
80
-
81
-
82
-
83
-
84
-
85
-
86
-
87
-
88
-
89
-
90
-
91
-
92
-
93
-
94
-
95
-
96
-
97
-
98
-
99
-
100
-
101
-
102
-
103
-
104
-
105
-
106
-
107
-
108
-
109
-
110
-
111
-
112
-
113
-
114
-
115
-
116
-
117
-
118
-
119
-
120
-
121
-
122
-
123
-
124
-
125
-
126
-
127
-
128
-
129
-
130
-
131
-
132
-
133
-
134
-
135
-
136
-
137
-
138
-
139
-
140
-
141
-
142
-
143
-
144
-
145
-
146
-
147
-
148
-
149
-
150
-
151
-
152
-
153
-
154
-
155
-
156
-
157
-
158
-
159
-
160
-
161
-
162
-
163
-
164
-
165
-
166
-
167
-
168
-
169
-
170
-
171
-
172
-
173
-
174
-
175
-
176
-
177
-
178
-
179
-
180
-
181
-
182
-
183
-
184
-
185
-
186
-
187
-
188
-
189
-
190
-
191
-
192
-
193
-
194
-
195
-
196
-
197
-
198
-
199
-
200
-
201
-
202
-
203
-
204
-
205
-
206
-
207
-
208
-
209
-
210
-
211
-
212
-
213
-
214
-
215
-
216
-
217
-
218
-
219
-
220
-
221
-
222
-
223
-
224
-
225
-
226
-
227
-
228
-
229
-
230
-
231
-
232
-
233
-
234
-
235
-
236
-
237
-
238
-
239
-
240
-
241
-
242
-
243
-
244
-
245
-
246
-
247
-
248
-
249
-
250
-
251
-
252
-
253
-
254
-
255
-
256
-
257
-
258
-
259
-
260
-
261
-
262
-
263
-
264
-
265
-
266
-
267
-
268
-
269
-
270
-
271
-
272
-
273
-
274
-
275
-
276
-
277
-
278
-
279
-
280
-
281
-
282
-
283
-
284
-
285
-
286
-
287
-
288
-
289
-
290
-
291
-
292
-
293
-
294
-
295
-
296
-
297
-
298
-
299
-
300
-
301
-
302
-
303
-
304
-
305
-
306
-
307
-
308
-
309
-
310
-
311
-
312
-
313
-
314
-
315
-
316
-
317
-
318
-
319
-
 320
320 -
 321
321 -
 322
322 -
 323
323 -
 324
324 -
 325
325 -
 326
326 -
 327
327 -
 328
328 -
 329
329 -
 330
330 -
 331
331 -
 332
332 -
 333
333 -
 334
334 -
 335
335 -
 336
336 -
 337
337 -
 338
338 -
 339
339 -
 340
340 -
341
-
342
-
343
-
344
-
345
-
346
-
347
-
348
-
349
-
350
-
351
-
352
-
353
-
354
-
355
-
356
-
357
-
358
-
359
-
360
-
361
-
362
-
363
-
364
-
365
-
366
-
367
-
368
-
369
-
370
-
371
-
372
-
373
-
374
-
375
-
376
-
377
-
378
-
379
-
380
-
381
-
382
-
383
-
384
-
385
-
386
-
387
-
388
-
389
-
390
-
391
-
392
-
393
-
394
-
395
-
396
-
397
-
398
-
399
-
400
-
401
-
402
 |
 |

329
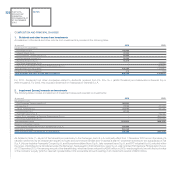
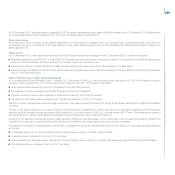
Investments in subsidiaries and changes during the year are provided in the following table:
Impairment Reclassification
% (losses)/ to Assets
(€ thousand) interest 31 December 2009 Additions Decreases reversals to be demerged 31 December 2010
Fiat Group Automobiles S.p.A. 100.00 4,474,081 1,050,000 5,524,081
Gross carrying amount 7,381,081 1,050,000 8,431,081
Accumulated impairment losses (2,907,000) (2,907,000)
Ferrari S.p.A. 85.00 1,055,204 1,055,204
Gross carrying amount 1,055,204 1,055,204
Accumulated impairment losses - -
Maserati S.p.A. 100.00 103,798 103,798
Gross carrying amount 103,798 103,798
Accumulated impairment losses - -
Fiat Netherlands Holding N.V. 100.00 3,827,346 750,000 (4,577,346) -
Gross carrying amount 3,827,346 750,000 (4,577,346) -
Accumulated impairment losses - -
Fiat Gestione Partecipazioni S.p.A. (formerly Iveco S.p.A.)
100.00 1,573,632 260,000 1,833,632
Gross carrying amount 2,133,632 2,133,632
Accumulated impairment losses (560,000) 260,000 (300,000)
Fiat Powertrain Technologies S.p.A. 100.00 648,912 (80,000) 568,912
Gross carrying amount 648,912 648,912
Accumulated impairment losses - (80,000) (80,000)
Magneti Marelli S.p.A. 99.99 611,854 611,854
Gross carrying amount 611,854 611,854
Accumulated impairment losses - -
Teksid S.p.A. 84.79 76,084 76,084
Gross carrying amount 129,070 129,070
Accumulated impairment losses (52,986) (52,986)
Teksid Aluminum S.r.l. 100.00 37,292 12,500 (11,100) 38,692
Gross carrying amount 68,292 12,500 80,792
Accumulated impairment losses (31,000) (11,100) (42,100)
Comau S.p.A. 100.00 92,050 40,000 (7,100) 124,950
Gross carrying amount 582,781 40,000 622,781
Accumulated impairment losses (490,731) (7,100) (497,831)
Fiat Partecipazioni S.p.A. 98.64 934,452 934,452
Gross carrying amount 950,452 950,452
Accumulated impairment losses (16,000) (16,000)
Fiat Finance S.p.A. 100.00 222,263 222,263
Gross carrying amount 222,263 222,263
Accumulated impairment losses - -
Fiat Finance North America Inc. 39.47 57,024 57,024
Gross carrying amount 58,585 58,585
Accumulated impairment losses (1,561) (1,561)
Other subsidiaries 123,317 406,353 (30) (6,100) (400,000) 123,540
Gross carrying amount 182,882 406,353 (30) (400,000) 189,205
Accumulated impairment losses (59,565) (6,100) (65,665)
Total investments in subsidiaries 13,837,309 2,258,853 (30) 155,700 (4,977,346) 11,274,486
Gross carrying amount 17,956,152 2,258,853 (30) (4,977,346) 15,237,629
Accumulated impairment losses (4,118,843) 155,700 (3,963,143)