Chrysler 2010 Annual Report Download - page 235
Download and view the complete annual report
Please find page 235 of the 2010 Chrysler annual report below. You can navigate through the pages in the report by either clicking on the pages listed below, or by using the keyword search tool below to find specific information within the annual report.-
 1
1 -
2
-
3
-
4
-
5
-
6
-
7
-
8
-
9
-
10
-
11
-
12
-
13
-
14
-
15
-
16
-
17
-
18
-
19
-
20
-
21
-
22
-
23
-
24
-
25
-
26
-
27
-
28
-
29
-
30
-
31
-
32
-
33
-
34
-
35
-
36
-
37
-
38
-
39
-
40
-
41
-
42
-
43
-
44
-
45
-
46
-
47
-
48
-
49
-
50
-
51
-
52
-
53
-
54
-
55
-
56
-
57
-
58
-
59
-
60
-
61
-
62
-
63
-
64
-
65
-
66
-
67
-
68
-
69
-
70
-
71
-
72
-
73
-
74
-
75
-
76
-
77
-
78
-
79
-
80
-
81
-
82
-
83
-
84
-
85
-
86
-
87
-
88
-
89
-
90
-
91
-
92
-
93
-
94
-
95
-
96
-
97
-
98
-
99
-
100
-
101
-
102
-
103
-
104
-
105
-
106
-
107
-
108
-
109
-
110
-
111
-
112
-
113
-
114
-
115
-
116
-
117
-
118
-
119
-
120
-
121
-
122
-
123
-
124
-
125
-
126
-
127
-
128
-
129
-
130
-
131
-
132
-
133
-
134
-
135
-
136
-
137
-
138
-
139
-
140
-
141
-
142
-
143
-
144
-
145
-
146
-
147
-
148
-
149
-
150
-
151
-
152
-
153
-
154
-
155
-
156
-
157
-
158
-
159
-
160
-
161
-
162
-
163
-
164
-
165
-
166
-
167
-
168
-
169
-
170
-
171
-
172
-
173
-
174
-
175
-
176
-
177
-
178
-
179
-
180
-
181
-
182
-
183
-
184
-
185
-
186
-
187
-
188
-
189
-
190
-
191
-
192
-
193
-
194
-
195
-
196
-
197
-
198
-
199
-
200
-
201
-
202
-
203
-
204
-
205
-
206
-
207
-
208
-
209
-
210
-
211
-
212
-
213
-
214
-
215
-
216
-
217
-
218
-
219
-
220
-
221
-
222
-
223
-
224
-
 225
225 -
 226
226 -
 227
227 -
 228
228 -
 229
229 -
 230
230 -
 231
231 -
 232
232 -
 233
233 -
 234
234 -
 235
235 -
 236
236 -
 237
237 -
 238
238 -
 239
239 -
 240
240 -
 241
241 -
 242
242 -
 243
243 -
 244
244 -
 245
245 -
246
-
247
-
248
-
249
-
250
-
251
-
252
-
253
-
254
-
255
-
256
-
257
-
258
-
259
-
260
-
261
-
262
-
263
-
264
-
265
-
266
-
267
-
268
-
269
-
270
-
271
-
272
-
273
-
274
-
275
-
276
-
277
-
278
-
279
-
280
-
281
-
282
-
283
-
284
-
285
-
286
-
287
-
288
-
289
-
290
-
291
-
292
-
293
-
294
-
295
-
296
-
297
-
298
-
299
-
300
-
301
-
302
-
303
-
304
-
305
-
306
-
307
-
308
-
309
-
310
-
311
-
312
-
313
-
314
-
315
-
316
-
317
-
318
-
319
-
320
-
321
-
322
-
323
-
324
-
325
-
326
-
327
-
328
-
329
-
330
-
331
-
332
-
333
-
334
-
335
-
336
-
337
-
338
-
339
-
340
-
341
-
342
-
343
-
344
-
345
-
346
-
347
-
348
-
349
-
350
-
351
-
352
-
353
-
354
-
355
-
356
-
357
-
358
-
359
-
360
-
361
-
362
-
363
-
364
-
365
-
366
-
367
-
368
-
369
-
370
-
371
-
372
-
373
-
374
-
375
-
376
-
377
-
378
-
379
-
380
-
381
-
382
-
383
-
384
-
385
-
386
-
387
-
388
-
389
-
390
-
391
-
392
-
393
-
394
-
395
-
396
-
397
-
398
-
399
-
400
-
401
-
402
 |
 |
FIAT GROUP
CONSOLIDATED
FINANCIAL
STATEMENTS
AT 31 DECEMBER
2010
NOTES
234
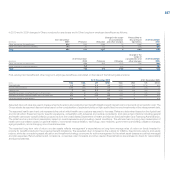
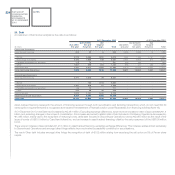
26. Debt
A breakdown of debt and an analysis by due date is as follows:
At 31 December 2010 At 31 December 2009
due between due due between due
due within one and beyond due within one and beyond
(€ million) one year five years five years Total one year five years five years Total
Continuing Operations
Asset-backed financing 498 29 6 533 4,536 2,535 15 7,086
Bonds 2,728 5,200 1,091 9,019 1,451 7,189 2,757 11,397
Borrowings from banks 3,430 3,068 159 6,657 3,531 4,553 310 8,394
Payables represented by securities 172 75 - 247 229 155 - 384
Other 1,001 228 254 1,483 864 137 265 1,266
Total Other debt 7,331 8,571 1,504 17,406 6,075 12,034 3,332 21,441
Total Continuing Operations 7,829 8,600 1,510 17,939 10,611 14,569 3,347 28,527
Discontinued Operations
Asset-backed financing 4,777 3,515 29 8,321 - - - -
Bonds - 735 1,318 2,053 - - - -
Borrowings from banks 1,391 910 67 2,368 - - - -
Payables represented by securities 45 72 - 117 - - - -
Other 134 30 46 210 - - - -
Total Other debt 1,570 1,747 1,431 4,748 - - - -
Total Discontinued Operations 6,347 5,262 1,460 13,069 - - - -
Total Debt 14,176 13,862 2,970 31,008 10,611 14,569 3,347 28,527
Asset-backed financing represents the amount of financing received through both securitisation and factoring transactions which do not meet IAS 39
derecognition requirements and is recognised as an asset in the statement of financial position under Receivables from financing activities (Note 19).
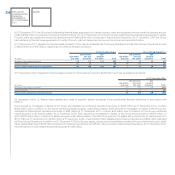
At 31 December 2010, total Debt had increased by €2,481 million. Excluding exchange differences, which led to an increase in debt of approximately €1.4
billion, and excluding changes in the scope of consolidation, this increase amounted to €994 million. Debt included in Continuing Operations decreased by
€1,086 million, mainly due to the repayment of maturing bonds, while debt included in Discontinued Operations rose by €2,080 million as the result of the
issue of bonds of US$1.5 billion by Case New Holland Inc. and an increase in asset-backed financing, offset by the early repayment of the US$500 million
bond.
There was an increase of approximately €1,213 million in asset backed financing, excluding exchange differences. This increase relates almost exclusively
to Discontinued Operations and amongst other things reflects improved market accessibility conditions for securitisations.
The rise in Other debt includes amongst other things the recognition of debt of €122 million arising from exercising the call option on 5% of Ferrari share
capital.