Chrysler 2010 Annual Report Download - page 358
Download and view the complete annual report
Please find page 358 of the 2010 Chrysler annual report below. You can navigate through the pages in the report by either clicking on the pages listed below, or by using the keyword search tool below to find specific information within the annual report.-
 1
1 -
2
-
3
-
4
-
5
-
6
-
7
-
8
-
9
-
10
-
11
-
12
-
13
-
14
-
15
-
16
-
17
-
18
-
19
-
20
-
21
-
22
-
23
-
24
-
25
-
26
-
27
-
28
-
29
-
30
-
31
-
32
-
33
-
34
-
35
-
36
-
37
-
38
-
39
-
40
-
41
-
42
-
43
-
44
-
45
-
46
-
47
-
48
-
49
-
50
-
51
-
52
-
53
-
54
-
55
-
56
-
57
-
58
-
59
-
60
-
61
-
62
-
63
-
64
-
65
-
66
-
67
-
68
-
69
-
70
-
71
-
72
-
73
-
74
-
75
-
76
-
77
-
78
-
79
-
80
-
81
-
82
-
83
-
84
-
85
-
86
-
87
-
88
-
89
-
90
-
91
-
92
-
93
-
94
-
95
-
96
-
97
-
98
-
99
-
100
-
101
-
102
-
103
-
104
-
105
-
106
-
107
-
108
-
109
-
110
-
111
-
112
-
113
-
114
-
115
-
116
-
117
-
118
-
119
-
120
-
121
-
122
-
123
-
124
-
125
-
126
-
127
-
128
-
129
-
130
-
131
-
132
-
133
-
134
-
135
-
136
-
137
-
138
-
139
-
140
-
141
-
142
-
143
-
144
-
145
-
146
-
147
-
148
-
149
-
150
-
151
-
152
-
153
-
154
-
155
-
156
-
157
-
158
-
159
-
160
-
161
-
162
-
163
-
164
-
165
-
166
-
167
-
168
-
169
-
170
-
171
-
172
-
173
-
174
-
175
-
176
-
177
-
178
-
179
-
180
-
181
-
182
-
183
-
184
-
185
-
186
-
187
-
188
-
189
-
190
-
191
-
192
-
193
-
194
-
195
-
196
-
197
-
198
-
199
-
200
-
201
-
202
-
203
-
204
-
205
-
206
-
207
-
208
-
209
-
210
-
211
-
212
-
213
-
214
-
215
-
216
-
217
-
218
-
219
-
220
-
221
-
222
-
223
-
224
-
225
-
226
-
227
-
228
-
229
-
230
-
231
-
232
-
233
-
234
-
235
-
236
-
237
-
238
-
239
-
240
-
241
-
242
-
243
-
244
-
245
-
246
-
247
-
248
-
249
-
250
-
251
-
252
-
253
-
254
-
255
-
256
-
257
-
258
-
259
-
260
-
261
-
262
-
263
-
264
-
265
-
266
-
267
-
268
-
269
-
270
-
271
-
272
-
273
-
274
-
275
-
276
-
277
-
278
-
279
-
280
-
281
-
282
-
283
-
284
-
285
-
286
-
287
-
288
-
289
-
290
-
291
-
292
-
293
-
294
-
295
-
296
-
297
-
298
-
299
-
300
-
301
-
302
-
303
-
304
-
305
-
306
-
307
-
308
-
309
-
310
-
311
-
312
-
313
-
314
-
315
-
316
-
317
-
318
-
319
-
320
-
321
-
322
-
323
-
324
-
325
-
326
-
327
-
328
-
329
-
330
-
331
-
332
-
333
-
334
-
335
-
336
-
337
-
338
-
339
-
340
-
341
-
342
-
343
-
344
-
345
-
346
-
347
-
 348
348 -
 349
349 -
 350
350 -
 351
351 -
 352
352 -
 353
353 -
 354
354 -
 355
355 -
 356
356 -
 357
357 -
 358
358 -
 359
359 -
 360
360 -
 361
361 -
 362
362 -
 363
363 -
 364
364 -
 365
365 -
 366
366 -
 367
367 -
 368
368 -
369
-
370
-
371
-
372
-
373
-
374
-
375
-
376
-
377
-
378
-
379
-
380
-
381
-
382
-
383
-
384
-
385
-
386
-
387
-
388
-
389
-
390
-
391
-
392
-
393
-
394
-
395
-
396
-
397
-
398
-
399
-
400
-
401
-
402
 |
 |

357
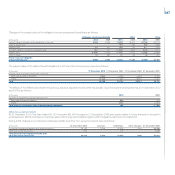
current financial receivables principally consist of current account deposits with Fiat Finance S.p.A. (see Note 15), while current financial payables consist
mainly of loans and other amounts payable to Fiat Finance S.p.A. and liabilities related to advances on the sale of receivables to banks (see Note 25).
In addition, non-current financial payables to Fiat Finance S.p.A. (see Note 21) include variable rate loans. The cost of these items is affected by changes
in short-term interest rates. For short-term or variable rate transactions, a hypothetical, immediate and adverse change of 10% in short-term interest
rates would have led to pre-tax net financial expense being approximately €1 million higher on an annualized basis (at 31 December 2009, the impact
was not material).
Other risks relating to derivative financial instruments
As discussed in Note 7, Fiat S.p.A. holds certain derivative financial instruments whose value is linked to the trends in the price of listed shares (equity swaps
on Fiat shares). Although these transactions were entered into for hedging purposes, they do not always qualify for hedge accounting under IFRS. As a result,
fluctuations in their value could affect the Company’s results.
The potential loss in fair value of derivative financial instruments held by the company at 31 December 2010, linked to changes in the price of listed shares,
which would arise in the case of a hypothetical, immediate and adverse change of 10% in the underlying securities, amounts to approximately €32 million
(€21 million at 31 December 2009). The difference over the prior year is attributable to the change in price of the instrument used for the simulation.
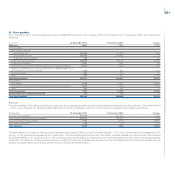
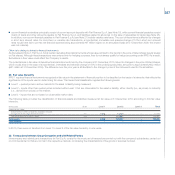
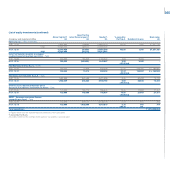
29. Fair value hierarchy
IFRS 7 requires financial instruments recognized at fair value in the statement of financial position to be classified on the basis of a hierarchy that reflects the
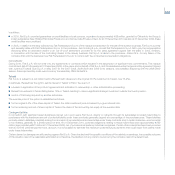
significance of the inputs used in determining fair value. This hierarchical classification applies the following levels:
Level 1 – quoted prices in active markets for the asset or liability being measured;
Level 2 – inputs other than quoted prices included within Level 1 that are observable for the asset or liability, either directly (i.e., as prices) or indirectly
(i.e., derived from prices) on the market;
Level 3 – inputs that are not based on observable market data.
The following table provides the classification of financial assets and liabilities measured at fair value at 31 December 2010 according to this fair value
hierarchy.
(€ thousand) Note Level 1 Level 2 Level 3 Total
Assets at fair value:
Investments in other companies (available for sale)
recognized at fair value directly in equity (11) 2,668 14,340 - 17,008
Derivative financial assets (current) (15) - 114,997 - 114,997
Total assets 2,668 129,337 - 132,005
Total liabilities - - - -
In 2010, there were no transfers from Level 1 to Level 2 of the fair value hierarchy or vice versa.
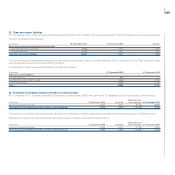
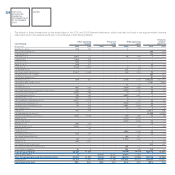
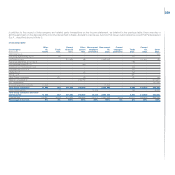
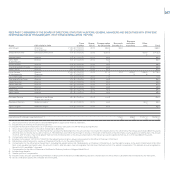
30. Transactions between Group Companies and with Related Parties
Intercompany and related party transactions for Fiat S.p.A. consist for the most part of transactions carried out with the company’s subsidiaries, carried out
on commercial terms that are normal in the respective markets, considering the characteristics of the goods or services involved.