Chrysler 2010 Annual Report Download - page 192
Download and view the complete annual report
Please find page 192 of the 2010 Chrysler annual report below. You can navigate through the pages in the report by either clicking on the pages listed below, or by using the keyword search tool below to find specific information within the annual report.-
 1
1 -
2
-
3
-
4
-
5
-
6
-
7
-
8
-
9
-
10
-
11
-
12
-
13
-
14
-
15
-
16
-
17
-
18
-
19
-
20
-
21
-
22
-
23
-
24
-
25
-
26
-
27
-
28
-
29
-
30
-
31
-
32
-
33
-
34
-
35
-
36
-
37
-
38
-
39
-
40
-
41
-
42
-
43
-
44
-
45
-
46
-
47
-
48
-
49
-
50
-
51
-
52
-
53
-
54
-
55
-
56
-
57
-
58
-
59
-
60
-
61
-
62
-
63
-
64
-
65
-
66
-
67
-
68
-
69
-
70
-
71
-
72
-
73
-
74
-
75
-
76
-
77
-
78
-
79
-
80
-
81
-
82
-
83
-
84
-
85
-
86
-
87
-
88
-
89
-
90
-
91
-
92
-
93
-
94
-
95
-
96
-
97
-
98
-
99
-
100
-
101
-
102
-
103
-
104
-
105
-
106
-
107
-
108
-
109
-
110
-
111
-
112
-
113
-
114
-
115
-
116
-
117
-
118
-
119
-
120
-
121
-
122
-
123
-
124
-
125
-
126
-
127
-
128
-
129
-
130
-
131
-
132
-
133
-
134
-
135
-
136
-
137
-
138
-
139
-
140
-
141
-
142
-
143
-
144
-
145
-
146
-
147
-
148
-
149
-
150
-
151
-
152
-
153
-
154
-
155
-
156
-
157
-
158
-
159
-
160
-
161
-
162
-
163
-
164
-
165
-
166
-
167
-
168
-
169
-
170
-
171
-
172
-
173
-
174
-
175
-
176
-
177
-
178
-
179
-
180
-
181
-
 182
182 -
 183
183 -
 184
184 -
 185
185 -
 186
186 -
 187
187 -
 188
188 -
 189
189 -
 190
190 -
 191
191 -
 192
192 -
 193
193 -
 194
194 -
 195
195 -
 196
196 -
 197
197 -
 198
198 -
 199
199 -
 200
200 -
 201
201 -
 202
202 -
203
-
204
-
205
-
206
-
207
-
208
-
209
-
210
-
211
-
212
-
213
-
214
-
215
-
216
-
217
-
218
-
219
-
220
-
221
-
222
-
223
-
224
-
225
-
226
-
227
-
228
-
229
-
230
-
231
-
232
-
233
-
234
-
235
-
236
-
237
-
238
-
239
-
240
-
241
-
242
-
243
-
244
-
245
-
246
-
247
-
248
-
249
-
250
-
251
-
252
-
253
-
254
-
255
-
256
-
257
-
258
-
259
-
260
-
261
-
262
-
263
-
264
-
265
-
266
-
267
-
268
-
269
-
270
-
271
-
272
-
273
-
274
-
275
-
276
-
277
-
278
-
279
-
280
-
281
-
282
-
283
-
284
-
285
-
286
-
287
-
288
-
289
-
290
-
291
-
292
-
293
-
294
-
295
-
296
-
297
-
298
-
299
-
300
-
301
-
302
-
303
-
304
-
305
-
306
-
307
-
308
-
309
-
310
-
311
-
312
-
313
-
314
-
315
-
316
-
317
-
318
-
319
-
320
-
321
-
322
-
323
-
324
-
325
-
326
-
327
-
328
-
329
-
330
-
331
-
332
-
333
-
334
-
335
-
336
-
337
-
338
-
339
-
340
-
341
-
342
-
343
-
344
-
345
-
346
-
347
-
348
-
349
-
350
-
351
-
352
-
353
-
354
-
355
-
356
-
357
-
358
-
359
-
360
-
361
-
362
-
363
-
364
-
365
-
366
-
367
-
368
-
369
-
370
-
371
-
372
-
373
-
374
-
375
-
376
-
377
-
378
-
379
-
380
-
381
-
382
-
383
-
384
-
385
-
386
-
387
-
388
-
389
-
390
-
391
-
392
-
393
-
394
-
395
-
396
-
397
-
398
-
399
-
400
-
401
-
402
 |
 |

191
In the Comau sector, the sensitivity analysis was carried out on the residual goodwill, which is mainly allocated to the Pico cash-generating unit, but no
matters arose to indicate that this may be significantly impaired.
The results obtained for the other sectors and related sensitivity analyses also confirmed the absence of significant impairment losses.
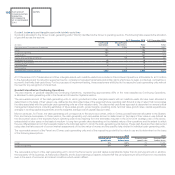
Goodwill classified as Discontinued Operations
The vast majority of goodwill classified as Discontinued Operations, representing approximately 97% of the total classified as Discontinued Operations and
amounting to €1,794 million, relates to the Agricultural and Construction Equipment sector, where the cash-generating units considered for the testing of
the recoverability of the goodwill are generally the product lines of the sectors themselves.
The recoverable amount of the cash-generating units to which goodwill and other intangible assets with an indefinite useful life have been allocated is
determined on the basis of their value in use, defined as the discounted value of the expected future operating cash flows at a rate of return that incorporates
the risks associated with the particular cash-generating units as of the valuation date. The discounted cash flows approach is dependent on several critical
management assumptions, including estimates of future sales growth, gross margins, operating costs, terminal value growth rates, capital expenditures,
changes in working capital requirements and the weighted average cost of capital (discount rate). More in particular, from 2006 to 2009, the Agricultural
and Construction Equipment sector, managed its business at the brand level: Case IH and New Holland for Agricultural Equipment, Case and New Holland
Construction for Construction Equipment; and Financial Services. In 2010, CNH began to manage its business at the Agricultural Equipment, Construction
Equipment, and Financial Services level. The cash generating units to which goodwill has been allocated consist of the following product lines:
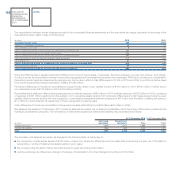
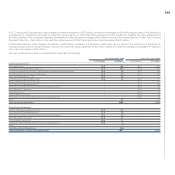
Amount allocated to goodwill
(€ million) at 31 December 2010
Agricultural equipment 1,280
Construction equipment 419
Financial Services 95
Total 1,794
To determine the recoverable amount of these cash-generating units, the sector relied on discounted cash flows and, as a further method, on market
multiples. In particular, the sector used the discounted cash flows approach as the primary approach for measuring the value in use of the Equipment
Operations businesses, while used the total asset market multiples approach as the primary approach for measuring the fair value of the Financial Services
reporting unit.
Expected cash flows used under this method are developed in conjunction with the budgeting and forecasting process of the sector and represent the most
likely amounts and timing of future cash flows based on the long range plan of CNH. The long range plan, which is updated annually and is reviewed by
the senior management of CNH, includes, among other things, the expected benefits of planned manufacturing and product development actions as well
as expectations regarding product pricing, market share and commodity costs, consistent with the assumptions reflected in the Fiat Group’s 2010-2014
Strategic Plan. The sector uses eight years of expected cash flows as management believes that this period generally reflects the underlying market cycles
for its businesses.
The discount rates used in the discounted cash flows approach are an estimate of the rate of return that a market participant would expect of each cash-
generating unit. To select an appropriate rate for discounting the future earnings stream, a review was made of short-term interest rates and the yields of
long-term corporate and government bonds, as well as the typical capital structure of companies in the industry. The discount rates used for each cash-
generating unit were suitably increased to take account of the risk inherent in the cash flow projections, as well as the risk level that would be perceived by
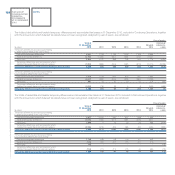
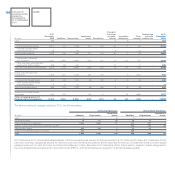
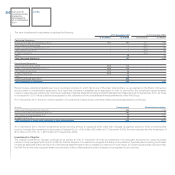
a market participant. Considering the above mentioned factors, the following discount rates before taxes as of 31 December 2010 were selected by CNH:
2010 2009
Agricultural equipment 17.0% 20.8% - 21.1%
Construction equipment 17.4% 19.2%