Chrysler 2010 Annual Report Download - page 190
Download and view the complete annual report
Please find page 190 of the 2010 Chrysler annual report below. You can navigate through the pages in the report by either clicking on the pages listed below, or by using the keyword search tool below to find specific information within the annual report.-
 1
1 -
2
-
3
-
4
-
5
-
6
-
7
-
8
-
9
-
10
-
11
-
12
-
13
-
14
-
15
-
16
-
17
-
18
-
19
-
20
-
21
-
22
-
23
-
24
-
25
-
26
-
27
-
28
-
29
-
30
-
31
-
32
-
33
-
34
-
35
-
36
-
37
-
38
-
39
-
40
-
41
-
42
-
43
-
44
-
45
-
46
-
47
-
48
-
49
-
50
-
51
-
52
-
53
-
54
-
55
-
56
-
57
-
58
-
59
-
60
-
61
-
62
-
63
-
64
-
65
-
66
-
67
-
68
-
69
-
70
-
71
-
72
-
73
-
74
-
75
-
76
-
77
-
78
-
79
-
80
-
81
-
82
-
83
-
84
-
85
-
86
-
87
-
88
-
89
-
90
-
91
-
92
-
93
-
94
-
95
-
96
-
97
-
98
-
99
-
100
-
101
-
102
-
103
-
104
-
105
-
106
-
107
-
108
-
109
-
110
-
111
-
112
-
113
-
114
-
115
-
116
-
117
-
118
-
119
-
120
-
121
-
122
-
123
-
124
-
125
-
126
-
127
-
128
-
129
-
130
-
131
-
132
-
133
-
134
-
135
-
136
-
137
-
138
-
139
-
140
-
141
-
142
-
143
-
144
-
145
-
146
-
147
-
148
-
149
-
150
-
151
-
152
-
153
-
154
-
155
-
156
-
157
-
158
-
159
-
160
-
161
-
162
-
163
-
164
-
165
-
166
-
167
-
168
-
169
-
170
-
171
-
172
-
173
-
174
-
175
-
176
-
177
-
178
-
179
-
 180
180 -
 181
181 -
 182
182 -
 183
183 -
 184
184 -
 185
185 -
 186
186 -
 187
187 -
 188
188 -
 189
189 -
 190
190 -
 191
191 -
 192
192 -
 193
193 -
 194
194 -
 195
195 -
 196
196 -
 197
197 -
 198
198 -
 199
199 -
 200
200 -
201
-
202
-
203
-
204
-
205
-
206
-
207
-
208
-
209
-
210
-
211
-
212
-
213
-
214
-
215
-
216
-
217
-
218
-
219
-
220
-
221
-
222
-
223
-
224
-
225
-
226
-
227
-
228
-
229
-
230
-
231
-
232
-
233
-
234
-
235
-
236
-
237
-
238
-
239
-
240
-
241
-
242
-
243
-
244
-
245
-
246
-
247
-
248
-
249
-
250
-
251
-
252
-
253
-
254
-
255
-
256
-
257
-
258
-
259
-
260
-
261
-
262
-
263
-
264
-
265
-
266
-
267
-
268
-
269
-
270
-
271
-
272
-
273
-
274
-
275
-
276
-
277
-
278
-
279
-
280
-
281
-
282
-
283
-
284
-
285
-
286
-
287
-
288
-
289
-
290
-
291
-
292
-
293
-
294
-
295
-
296
-
297
-
298
-
299
-
300
-
301
-
302
-
303
-
304
-
305
-
306
-
307
-
308
-
309
-
310
-
311
-
312
-
313
-
314
-
315
-
316
-
317
-
318
-
319
-
320
-
321
-
322
-
323
-
324
-
325
-
326
-
327
-
328
-
329
-
330
-
331
-
332
-
333
-
334
-
335
-
336
-
337
-
338
-
339
-
340
-
341
-
342
-
343
-
344
-
345
-
346
-
347
-
348
-
349
-
350
-
351
-
352
-
353
-
354
-
355
-
356
-
357
-
358
-
359
-
360
-
361
-
362
-
363
-
364
-
365
-
366
-
367
-
368
-
369
-
370
-
371
-
372
-
373
-
374
-
375
-
376
-
377
-
378
-
379
-
380
-
381
-
382
-
383
-
384
-
385
-
386
-
387
-
388
-
389
-
390
-
391
-
392
-
393
-
394
-
395
-
396
-
397
-
398
-
399
-
400
-
401
-
402
 |
 |

189
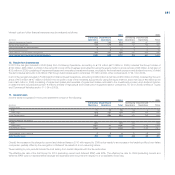
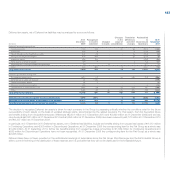
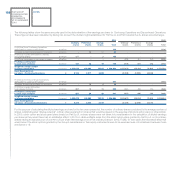
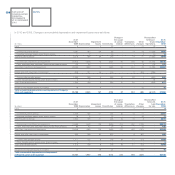
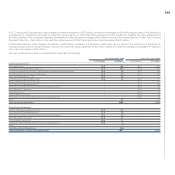
In 2010 and in 2009 changes in the net carrying amount of Intangible assets were as follows:
Change in the Translation Reclassified
At 31 scope of diff. to
At 31
December Amorti- Impairment Divesti- consoli- and other Discontinued December
(€ million) 2009 Additions sation losses tures dation changes Operations 2010
Goodwill 2,776 - - - - - 152 (1,848) 1,080
Trademarks and other intangible assets
with indefinite useful lives 165 - - - - - 12 (174)
3
Development costs externally acquired 1,342 357 (301) (10) (1) - 13 (273) 1,127
Development costs internally generated 2,251 925 (434) (32) (3) - 37 (962) 1,782
Total Development costs 3,593 1,282 (735) (42) (4) - 50 (1,235) 2,909
Patents, concessions and licenses externally acquired 359 78 (118) - - 1 16 (179) 157
Other intangible assets externally acquired 295 86 (86) (6) - 3 28 (124) 196
Advances and intangible assets in
progress externally acquired 11 12 - (4) - - (7) (7)
5
Total net carrying amount of Intangible assets 7,199 1,458 (939) (52) (4) 4 251 (3,567) 4,350
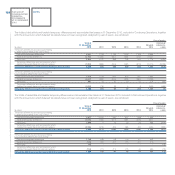
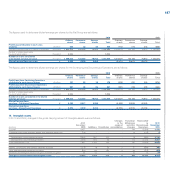
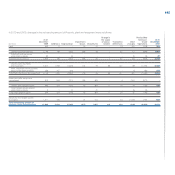
Change in the Translation Reclassified
At 31 scope of diff. to Assets At 31
December Amorti- Impairment Divesti- consoli- and other held December
(€ million) 2008 Additions sation losses tures dation changes for sale 2009
Goodwill 2,815 - - - - - (39) - 2,776
Trademarks and other intangible assets
with indefinite useful lives 170 - - - - - (5) -
165
Development costs externally acquired 1,344 307 (286) (50) (22) - 49 - 1,342
Development costs internally generated 1,985 739 (419) (64) (8) - 18 - 2,251
Total Development costs 3,329 1,046 (705) (114) (30) - 67 - 3,593
Patents, concessions and licenses externally acquired 389 68 (126) - (4) - 32 - 359
Other intangible assets externally acquired 307 69 (73) - (5) - (3) - 295
Advances and intangible assets in
progress externally acquired 38 7 - (10) - - (24) -
11
Total net carrying amount of Intangible assets 7,048 1,190 (904) (124) (39) - 28 - 7,199
Foreign exchange gains of €258 million in 2010 principally reflect the appreciation of the US Dollar and the Brazilian Real against the Euro. Foreign exchange
gains of €27 million in 2009 principally reflect the appreciation of the Brazilian Real against the Euro, partially offset by the depreciation of the US Dollar
against the Euro.
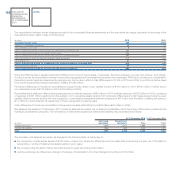
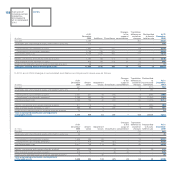
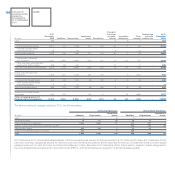
The above mentioned changes include the following items for 2010:
Continuing Operations Discontinued Operations
Impairment Impairment
(€ million) Additions Amortisations losses Additions Amortisations losses
Development costs 886 576 39 396 159 3
Patents, concessions and licenses externally acquired 58 67 - 20 51 -
Other intangible assets externally acquired 60 50 6 26 36 -
Advances and intangible assets in progress externally acquired 6 - 4 6 - -
Total 1,010 693 49 448 246 3