Chrysler 2010 Annual Report Download - page 134
Download and view the complete annual report
Please find page 134 of the 2010 Chrysler annual report below. You can navigate through the pages in the report by either clicking on the pages listed below, or by using the keyword search tool below to find specific information within the annual report.-
 1
1 -
2
-
3
-
4
-
5
-
6
-
7
-
8
-
9
-
10
-
11
-
12
-
13
-
14
-
15
-
16
-
17
-
18
-
19
-
20
-
21
-
22
-
23
-
24
-
25
-
26
-
27
-
28
-
29
-
30
-
31
-
32
-
33
-
34
-
35
-
36
-
37
-
38
-
39
-
40
-
41
-
42
-
43
-
44
-
45
-
46
-
47
-
48
-
49
-
50
-
51
-
52
-
53
-
54
-
55
-
56
-
57
-
58
-
59
-
60
-
61
-
62
-
63
-
64
-
65
-
66
-
67
-
68
-
69
-
70
-
71
-
72
-
73
-
74
-
75
-
76
-
77
-
78
-
79
-
80
-
81
-
82
-
83
-
84
-
85
-
86
-
87
-
88
-
89
-
90
-
91
-
92
-
93
-
94
-
95
-
96
-
97
-
98
-
99
-
100
-
101
-
102
-
103
-
104
-
105
-
106
-
107
-
108
-
109
-
110
-
111
-
112
-
113
-
114
-
115
-
116
-
117
-
118
-
119
-
120
-
121
-
122
-
123
-
 124
124 -
 125
125 -
 126
126 -
 127
127 -
 128
128 -
 129
129 -
 130
130 -
 131
131 -
 132
132 -
 133
133 -
 134
134 -
 135
135 -
 136
136 -
 137
137 -
 138
138 -
 139
139 -
 140
140 -
 141
141 -
 142
142 -
 143
143 -
 144
144 -
145
-
146
-
147
-
148
-
149
-
150
-
151
-
152
-
153
-
154
-
155
-
156
-
157
-
158
-
159
-
160
-
161
-
162
-
163
-
164
-
165
-
166
-
167
-
168
-
169
-
170
-
171
-
172
-
173
-
174
-
175
-
176
-
177
-
178
-
179
-
180
-
181
-
182
-
183
-
184
-
185
-
186
-
187
-
188
-
189
-
190
-
191
-
192
-
193
-
194
-
195
-
196
-
197
-
198
-
199
-
200
-
201
-
202
-
203
-
204
-
205
-
206
-
207
-
208
-
209
-
210
-
211
-
212
-
213
-
214
-
215
-
216
-
217
-
218
-
219
-
220
-
221
-
222
-
223
-
224
-
225
-
226
-
227
-
228
-
229
-
230
-
231
-
232
-
233
-
234
-
235
-
236
-
237
-
238
-
239
-
240
-
241
-
242
-
243
-
244
-
245
-
246
-
247
-
248
-
249
-
250
-
251
-
252
-
253
-
254
-
255
-
256
-
257
-
258
-
259
-
260
-
261
-
262
-
263
-
264
-
265
-
266
-
267
-
268
-
269
-
270
-
271
-
272
-
273
-
274
-
275
-
276
-
277
-
278
-
279
-
280
-
281
-
282
-
283
-
284
-
285
-
286
-
287
-
288
-
289
-
290
-
291
-
292
-
293
-
294
-
295
-
296
-
297
-
298
-
299
-
300
-
301
-
302
-
303
-
304
-
305
-
306
-
307
-
308
-
309
-
310
-
311
-
312
-
313
-
314
-
315
-
316
-
317
-
318
-
319
-
320
-
321
-
322
-
323
-
324
-
325
-
326
-
327
-
328
-
329
-
330
-
331
-
332
-
333
-
334
-
335
-
336
-
337
-
338
-
339
-
340
-
341
-
342
-
343
-
344
-
345
-
346
-
347
-
348
-
349
-
350
-
351
-
352
-
353
-
354
-
355
-
356
-
357
-
358
-
359
-
360
-
361
-
362
-
363
-
364
-
365
-
366
-
367
-
368
-
369
-
370
-
371
-
372
-
373
-
374
-
375
-
376
-
377
-
378
-
379
-
380
-
381
-
382
-
383
-
384
-
385
-
386
-
387
-
388
-
389
-
390
-
391
-
392
-
393
-
394
-
395
-
396
-
397
-
398
-
399
-
400
-
401
-
402
 |
 |

133
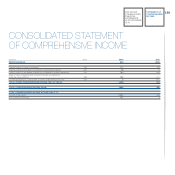
Net financial expense totaled €93 million and consisted of €204 million in net financial charges, primarily for interest on financial debt, which was partially
offset by a €111 million gain on the mark-to-market value of two stock-option related equity swaps on Fiat S.p.A. ordinary shares. For 2009, there was
net financial expense of €14 million consisting of €131 million in financial charges that was largely offset by a €117 million gain on measurement of the
above equity swaps. The €79 million increase over the previous year was due to higher interest payments following an increase in debt associated with the
recapitalization of subsidiaries.
There was a €34 million credit for income taxes for the year primarily attributable to the contribution of tax losses by Fiat S.p.A. to the tax consolidation
for the Group’s Italian companies. For 2009, income taxes totaled €6 million and consisted of IRAP (Italian regional income tax) amounts paid in relation to
taxable income for 2008, net of the release of deferred tax provisions related to prior years.
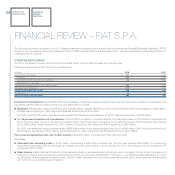
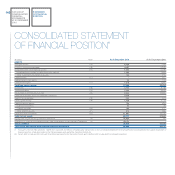
STATEMENT OF FINANCIAL POSITION
Following is a summary of Fiat S.p.A.’s statement of financial position:
(€ million) 31.12.2010 31.12.2009
Non-current assets 11,599 14,049
of which: Investments 11,423 13,991
Shareholdings to be demerged 4,977 -
Working capital (101) (235)
NET CAPITAL INVESTED 16,475 13,814
EQUITY 12,704 12,487
NET DEBT 3,771 1,327
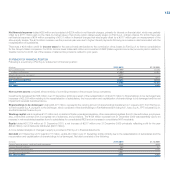
Non-current assets consisted almost entirely of controlling interests in the principal Group companies.
Investments decreased €2,568 million over 31 December 2009 as a result of the reclassification of €4,977 million to Shareholdings to be demerged less
increases of €2,259 million relating to the recapitalization of subsidiaries, the incorporation and capitalization of shareholdings to be demerged and the net
impairment reversals described above.
Shareholdings to be demerged, totaling €4,977 million, represents the carrying amount of shareholdings transferred on 1 January 2011 from Fiat S.p.A.
to Fiat Industrial S.p.A. pursuant to the Demerger, which consisted of the shareholdings in Fiat Netherlands Holding N.V., Iveco S.p.A., FPT Industrial S.p.A.
and Fiat Industrial Finance S.p.A.
Working capital was a negative €101 million and consisted of trade receivables/payables, other receivables/payables (from/to tax authorities, employees,
etc.), inventoried contract work in progress net of advances, and provisions. The €134 million increase from 31 December 2009 was essentially due to an
increase in net receivables/payables from/to subsidiaries for consolidated IRES and an increase in consolidated VAT receivable.
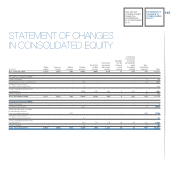
Equity totaled €12,704 million at 31 December 2010, a net increase of €217 million over 31 December 2009 principally reflecting profit for the year
(€442 million), net of dividends distributed (€237 million).
A more detailed analysis of changes in equity is provided in Fiat S.p.A.’s financial statements.
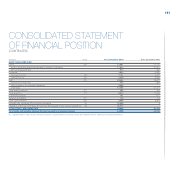
Net debt at 31 December 2010 was €3,771 million, up €2,444 million over 31 December 2009 primarily due to the recapitalization of subsidiaries and the
incorporation and capitalization of shareholdings to be demerged. Net debt consisted of the following:
(€ million)
31.12.2010 31.12.2009
Current financial assets, cash and cash equivalents (312) (646)
Current financial liabilities 295 157
Non-current financial liabilities 2,561 1,816
Net debt to be demerged 1,227 -
NET DEBT/(CASH) 3,771 1,327