Chrysler 2010 Annual Report Download - page 198
Download and view the complete annual report
Please find page 198 of the 2010 Chrysler annual report below. You can navigate through the pages in the report by either clicking on the pages listed below, or by using the keyword search tool below to find specific information within the annual report.-
 1
1 -
2
-
3
-
4
-
5
-
6
-
7
-
8
-
9
-
10
-
11
-
12
-
13
-
14
-
15
-
16
-
17
-
18
-
19
-
20
-
21
-
22
-
23
-
24
-
25
-
26
-
27
-
28
-
29
-
30
-
31
-
32
-
33
-
34
-
35
-
36
-
37
-
38
-
39
-
40
-
41
-
42
-
43
-
44
-
45
-
46
-
47
-
48
-
49
-
50
-
51
-
52
-
53
-
54
-
55
-
56
-
57
-
58
-
59
-
60
-
61
-
62
-
63
-
64
-
65
-
66
-
67
-
68
-
69
-
70
-
71
-
72
-
73
-
74
-
75
-
76
-
77
-
78
-
79
-
80
-
81
-
82
-
83
-
84
-
85
-
86
-
87
-
88
-
89
-
90
-
91
-
92
-
93
-
94
-
95
-
96
-
97
-
98
-
99
-
100
-
101
-
102
-
103
-
104
-
105
-
106
-
107
-
108
-
109
-
110
-
111
-
112
-
113
-
114
-
115
-
116
-
117
-
118
-
119
-
120
-
121
-
122
-
123
-
124
-
125
-
126
-
127
-
128
-
129
-
130
-
131
-
132
-
133
-
134
-
135
-
136
-
137
-
138
-
139
-
140
-
141
-
142
-
143
-
144
-
145
-
146
-
147
-
148
-
149
-
150
-
151
-
152
-
153
-
154
-
155
-
156
-
157
-
158
-
159
-
160
-
161
-
162
-
163
-
164
-
165
-
166
-
167
-
168
-
169
-
170
-
171
-
172
-
173
-
174
-
175
-
176
-
177
-
178
-
179
-
180
-
181
-
182
-
183
-
184
-
185
-
186
-
187
-
 188
188 -
 189
189 -
 190
190 -
 191
191 -
 192
192 -
 193
193 -
 194
194 -
 195
195 -
 196
196 -
 197
197 -
 198
198 -
 199
199 -
 200
200 -
 201
201 -
 202
202 -
 203
203 -
 204
204 -
 205
205 -
 206
206 -
 207
207 -
 208
208 -
209
-
210
-
211
-
212
-
213
-
214
-
215
-
216
-
217
-
218
-
219
-
220
-
221
-
222
-
223
-
224
-
225
-
226
-
227
-
228
-
229
-
230
-
231
-
232
-
233
-
234
-
235
-
236
-
237
-
238
-
239
-
240
-
241
-
242
-
243
-
244
-
245
-
246
-
247
-
248
-
249
-
250
-
251
-
252
-
253
-
254
-
255
-
256
-
257
-
258
-
259
-
260
-
261
-
262
-
263
-
264
-
265
-
266
-
267
-
268
-
269
-
270
-
271
-
272
-
273
-
274
-
275
-
276
-
277
-
278
-
279
-
280
-
281
-
282
-
283
-
284
-
285
-
286
-
287
-
288
-
289
-
290
-
291
-
292
-
293
-
294
-
295
-
296
-
297
-
298
-
299
-
300
-
301
-
302
-
303
-
304
-
305
-
306
-
307
-
308
-
309
-
310
-
311
-
312
-
313
-
314
-
315
-
316
-
317
-
318
-
319
-
320
-
321
-
322
-
323
-
324
-
325
-
326
-
327
-
328
-
329
-
330
-
331
-
332
-
333
-
334
-
335
-
336
-
337
-
338
-
339
-
340
-
341
-
342
-
343
-
344
-
345
-
346
-
347
-
348
-
349
-
350
-
351
-
352
-
353
-
354
-
355
-
356
-
357
-
358
-
359
-
360
-
361
-
362
-
363
-
364
-
365
-
366
-
367
-
368
-
369
-
370
-
371
-
372
-
373
-
374
-
375
-
376
-
377
-
378
-
379
-
380
-
381
-
382
-
383
-
384
-
385
-
386
-
387
-
388
-
389
-
390
-
391
-
392
-
393
-
394
-
395
-
396
-
397
-
398
-
399
-
400
-
401
-
402
 |
 |

197
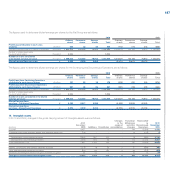
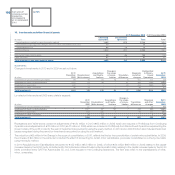
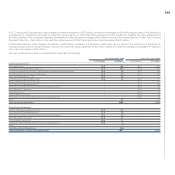
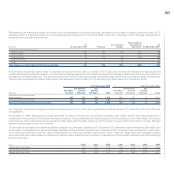
These amounts are classified as Continuing or Discontinued Operations as follows:
At 31 December 2010 At 31 December 2009
Continuing Discontinued
(€ million) Operations Operations Total Total
Land and industrial buildings of pledged as security for debt 128 9 137 135
Plant and machinery pledged as security for debt and other commitments 282 36 318 244
Other assets pledged as security for debt and other commitments 7 3 10 9
Total 417 48 465 388
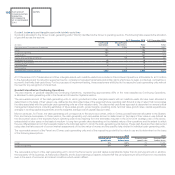
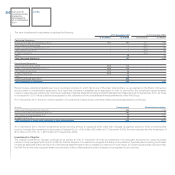
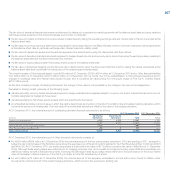
At 31 December 2010, the Group had contractual commitments for the purchase of property, plant and equipment amounting to €858 million (€666 million
at 31 December 2009), of which €697 million classified as Continuing Operations and €161 million classified as Discontinued Operations.
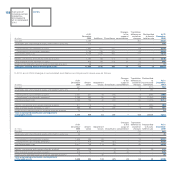
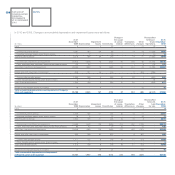
Additions of €2,604 million in 2010 relate for €1,854 million to the Continuing Operations (in particular to sectors Fiat Group Automobiles, Fiat Powertrain,
Components and Ferrari), and for €750 million to the Discontinued Operations (in particular to sectors Trucks and Commercial Vehicles and Agricultural
and Construction Equipments).
During 2010, the Group reviewed the recoverable amount of certain buildings, plant, machinery and industrial equipment in order to take into consideration
restructuring plans drawn up for certain businesses. This assessment led to the recognition of impairment losses of €141 million (€174 million in 2009).
Such impairment losses relate to Continuing Operations for €139 million and in particular to the sectors Fiat Group Automobiles and Components with
€73 million being recognised in Trading profit/(loss) and €66 million as Restructuring costs. Impairment losses relating to Discontinued Operations amounts
to €2 million and were recognised by the Trucks and Commercial Vehicles sector in the Trading profit/(loss). With reference to Discontinued Operations,
moreover, during 2010 the Trucks and Commercial Vehicles sector recognised impairment losses on Assets sold with a buy-back commitment for an
amount of €26 million (€32 million in 2009) in order to align their carrying amount to market value. These losses are fully recognised in Cost of sales in 2010
(recognised in Cost of sales for €24 million in and in Other unusual income (expenses) for €8 million in 2009).
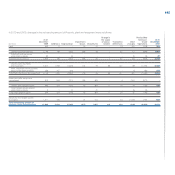
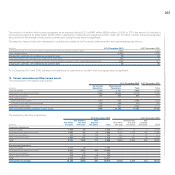
In 2010 the column Other changes includes the reclassification of the prior year balances for Advances and tangible assets in progress to the appropriate
categories when the assets were effectively acquired and put into operation, as well as, for the Discontinued Operations, the reclassification to Inventories
of Assets sold with a buy-back commitment and held-for-sale until the agreement expiry date amounting to €167 million in 2010 (€165 million in 2009).
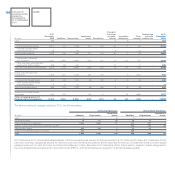
In 2010, the column Change in the scope of consolidation, showing an overall increase of €113 million, mainly reflects the line-by-line consolidation of the
Fiat Powertrain Polska Sp.z.o.o. which is included in Continuing Operations. In 2009, the column Change in the scope of consolidation, showing an overall
increase of €53 million, mainly reflected the line-by-line consolidation of the entity Fiat Automobiles Serbia d.o.o. Kragujevac.
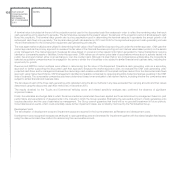
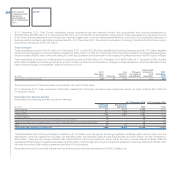
In 2010 exchange gains of €401 million principally reflect the appreciation of the US Dollar, the Real and the Zloty against the Euro. In 2009 exchange
gains of €401 million reflect the appreciation of the Real against the Euro, partially offset by the depreciation of the US Dollar and the Argentine Peso
against the Euro.