Chrysler 2010 Annual Report Download - page 29
Download and view the complete annual report
Please find page 29 of the 2010 Chrysler annual report below. You can navigate through the pages in the report by either clicking on the pages listed below, or by using the keyword search tool below to find specific information within the annual report.-
 1
1 -
2
-
3
-
4
-
5
-
6
-
7
-
8
-
9
-
10
-
11
-
12
-
13
-
14
-
15
-
16
-
17
-
18
-
 19
19 -
 20
20 -
 21
21 -
 22
22 -
 23
23 -
 24
24 -
 25
25 -
 26
26 -
 27
27 -
 28
28 -
 29
29 -
 30
30 -
 31
31 -
 32
32 -
 33
33 -
 34
34 -
 35
35 -
 36
36 -
 37
37 -
 38
38 -
 39
39 -
40
-
41
-
42
-
43
-
44
-
45
-
46
-
47
-
48
-
49
-
50
-
51
-
52
-
53
-
54
-
55
-
56
-
57
-
58
-
59
-
60
-
61
-
62
-
63
-
64
-
65
-
66
-
67
-
68
-
69
-
70
-
71
-
72
-
73
-
74
-
75
-
76
-
77
-
78
-
79
-
80
-
81
-
82
-
83
-
84
-
85
-
86
-
87
-
88
-
89
-
90
-
91
-
92
-
93
-
94
-
95
-
96
-
97
-
98
-
99
-
100
-
101
-
102
-
103
-
104
-
105
-
106
-
107
-
108
-
109
-
110
-
111
-
112
-
113
-
114
-
115
-
116
-
117
-
118
-
119
-
120
-
121
-
122
-
123
-
124
-
125
-
126
-
127
-
128
-
129
-
130
-
131
-
132
-
133
-
134
-
135
-
136
-
137
-
138
-
139
-
140
-
141
-
142
-
143
-
144
-
145
-
146
-
147
-
148
-
149
-
150
-
151
-
152
-
153
-
154
-
155
-
156
-
157
-
158
-
159
-
160
-
161
-
162
-
163
-
164
-
165
-
166
-
167
-
168
-
169
-
170
-
171
-
172
-
173
-
174
-
175
-
176
-
177
-
178
-
179
-
180
-
181
-
182
-
183
-
184
-
185
-
186
-
187
-
188
-
189
-
190
-
191
-
192
-
193
-
194
-
195
-
196
-
197
-
198
-
199
-
200
-
201
-
202
-
203
-
204
-
205
-
206
-
207
-
208
-
209
-
210
-
211
-
212
-
213
-
214
-
215
-
216
-
217
-
218
-
219
-
220
-
221
-
222
-
223
-
224
-
225
-
226
-
227
-
228
-
229
-
230
-
231
-
232
-
233
-
234
-
235
-
236
-
237
-
238
-
239
-
240
-
241
-
242
-
243
-
244
-
245
-
246
-
247
-
248
-
249
-
250
-
251
-
252
-
253
-
254
-
255
-
256
-
257
-
258
-
259
-
260
-
261
-
262
-
263
-
264
-
265
-
266
-
267
-
268
-
269
-
270
-
271
-
272
-
273
-
274
-
275
-
276
-
277
-
278
-
279
-
280
-
281
-
282
-
283
-
284
-
285
-
286
-
287
-
288
-
289
-
290
-
291
-
292
-
293
-
294
-
295
-
296
-
297
-
298
-
299
-
300
-
301
-
302
-
303
-
304
-
305
-
306
-
307
-
308
-
309
-
310
-
311
-
312
-
313
-
314
-
315
-
316
-
317
-
318
-
319
-
320
-
321
-
322
-
323
-
324
-
325
-
326
-
327
-
328
-
329
-
330
-
331
-
332
-
333
-
334
-
335
-
336
-
337
-
338
-
339
-
340
-
341
-
342
-
343
-
344
-
345
-
346
-
347
-
348
-
349
-
350
-
351
-
352
-
353
-
354
-
355
-
356
-
357
-
358
-
359
-
360
-
361
-
362
-
363
-
364
-
365
-
366
-
367
-
368
-
369
-
370
-
371
-
372
-
373
-
374
-
375
-
376
-
377
-
378
-
379
-
380
-
381
-
382
-
383
-
384
-
385
-
386
-
387
-
388
-
389
-
390
-
391
-
392
-
393
-
394
-
395
-
396
-
397
-
398
-
399
-
400
-
401
-
402
 |
 |

28
HIGHLIGHTS
REPORT ON
OPERATIONS
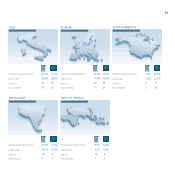
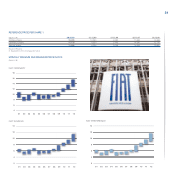
Fiat Group pre Demerger
Revenues by
geographic market
No. of companies Employees Plants R&D Centers (€ million)
2010 2009 2010 2009 2010 2009 2010 2009 2010 2009
Italy 133 140 81,353 80,434 60 64 43 48 11,907 12,744
Europe (excluding Italy) 267 265 47,080 45,826 54 57 34 33 18,626 17,668
North America 70 74 11,423 11,157 17 16 16 15 6,302 5,021
Mercosur 35 33 47,471 42,397 26 27 9 10 13,228 9,798
Other regions 111 109 12,597 10,200 24 24 11 11 6,195 4,871
TOTAL 616 621 199,924 190,014 181 188 113 117 56,258 50,102
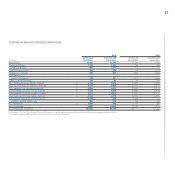
SELECT DATA BY REGION
Continuing Operations
Revenues by
geographic market
No. of companies Employees Plants R&D Centers (€ million)
2010 2010 2009 2010 2009 2010 2009 2010 2009
Italy 112 63,214 61,758 44 48 30 33 9,782 10,747
Europe (excluding Italy) 147 24,616 22,940 29 32 13 13 11,857 11,056
North America 21 1,690 1,410 6 5 3 3 1,105 800
Mercosur 27 39,498 35,915 18 19 5 5 10,027 7,736
Other regions 71 8,783 6,748 16 16 7 7 3,109 2,345
TOTAL 378 137,801 128,771 113 120 58 61 35,880 32,684
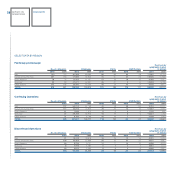
Discontinued Operations
Revenues by
geographic market
No. of companies Employees Plants R&D Centers (€ million)
2010 2010 2009 2010 2009 2010 2009 2010 2009
Italy 21 18,139 18,676 16 16 13 15 2,491 2,250
Europe (excluding Italy) 120 22,464 22,886 25 25 21 20 6,871 6,687
North America 49 9,733 9,747 11 11 13 12 5,200 4,226
Mercosur 8 7,973 6,482 8 8 4 5 3,684 2,274
Other regions 40 3,814 3,452 8 8 4 4 3,096 2,531
TOTAL 238 62,123 61,243 68 68 55 56 21,342 17,968