Chrysler 2010 Annual Report Download - page 31
Download and view the complete annual report
Please find page 31 of the 2010 Chrysler annual report below. You can navigate through the pages in the report by either clicking on the pages listed below, or by using the keyword search tool below to find specific information within the annual report.-
 1
1 -
2
-
3
-
4
-
5
-
6
-
7
-
8
-
9
-
10
-
11
-
12
-
13
-
14
-
15
-
16
-
17
-
18
-
19
-
20
-
 21
21 -
 22
22 -
 23
23 -
 24
24 -
 25
25 -
 26
26 -
 27
27 -
 28
28 -
 29
29 -
 30
30 -
 31
31 -
 32
32 -
 33
33 -
 34
34 -
 35
35 -
 36
36 -
 37
37 -
 38
38 -
 39
39 -
 40
40 -
 41
41 -
42
-
43
-
44
-
45
-
46
-
47
-
48
-
49
-
50
-
51
-
52
-
53
-
54
-
55
-
56
-
57
-
58
-
59
-
60
-
61
-
62
-
63
-
64
-
65
-
66
-
67
-
68
-
69
-
70
-
71
-
72
-
73
-
74
-
75
-
76
-
77
-
78
-
79
-
80
-
81
-
82
-
83
-
84
-
85
-
86
-
87
-
88
-
89
-
90
-
91
-
92
-
93
-
94
-
95
-
96
-
97
-
98
-
99
-
100
-
101
-
102
-
103
-
104
-
105
-
106
-
107
-
108
-
109
-
110
-
111
-
112
-
113
-
114
-
115
-
116
-
117
-
118
-
119
-
120
-
121
-
122
-
123
-
124
-
125
-
126
-
127
-
128
-
129
-
130
-
131
-
132
-
133
-
134
-
135
-
136
-
137
-
138
-
139
-
140
-
141
-
142
-
143
-
144
-
145
-
146
-
147
-
148
-
149
-
150
-
151
-
152
-
153
-
154
-
155
-
156
-
157
-
158
-
159
-
160
-
161
-
162
-
163
-
164
-
165
-
166
-
167
-
168
-
169
-
170
-
171
-
172
-
173
-
174
-
175
-
176
-
177
-
178
-
179
-
180
-
181
-
182
-
183
-
184
-
185
-
186
-
187
-
188
-
189
-
190
-
191
-
192
-
193
-
194
-
195
-
196
-
197
-
198
-
199
-
200
-
201
-
202
-
203
-
204
-
205
-
206
-
207
-
208
-
209
-
210
-
211
-
212
-
213
-
214
-
215
-
216
-
217
-
218
-
219
-
220
-
221
-
222
-
223
-
224
-
225
-
226
-
227
-
228
-
229
-
230
-
231
-
232
-
233
-
234
-
235
-
236
-
237
-
238
-
239
-
240
-
241
-
242
-
243
-
244
-
245
-
246
-
247
-
248
-
249
-
250
-
251
-
252
-
253
-
254
-
255
-
256
-
257
-
258
-
259
-
260
-
261
-
262
-
263
-
264
-
265
-
266
-
267
-
268
-
269
-
270
-
271
-
272
-
273
-
274
-
275
-
276
-
277
-
278
-
279
-
280
-
281
-
282
-
283
-
284
-
285
-
286
-
287
-
288
-
289
-
290
-
291
-
292
-
293
-
294
-
295
-
296
-
297
-
298
-
299
-
300
-
301
-
302
-
303
-
304
-
305
-
306
-
307
-
308
-
309
-
310
-
311
-
312
-
313
-
314
-
315
-
316
-
317
-
318
-
319
-
320
-
321
-
322
-
323
-
324
-
325
-
326
-
327
-
328
-
329
-
330
-
331
-
332
-
333
-
334
-
335
-
336
-
337
-
338
-
339
-
340
-
341
-
342
-
343
-
344
-
345
-
346
-
347
-
348
-
349
-
350
-
351
-
352
-
353
-
354
-
355
-
356
-
357
-
358
-
359
-
360
-
361
-
362
-
363
-
364
-
365
-
366
-
367
-
368
-
369
-
370
-
371
-
372
-
373
-
374
-
375
-
376
-
377
-
378
-
379
-
380
-
381
-
382
-
383
-
384
-
385
-
386
-
387
-
388
-
389
-
390
-
391
-
392
-
393
-
394
-
395
-
396
-
397
-
398
-
399
-
400
-
401
-
402
 |
 |
REPORT ON
OPERATIONS
SHAREHOLDERS
30
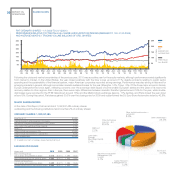
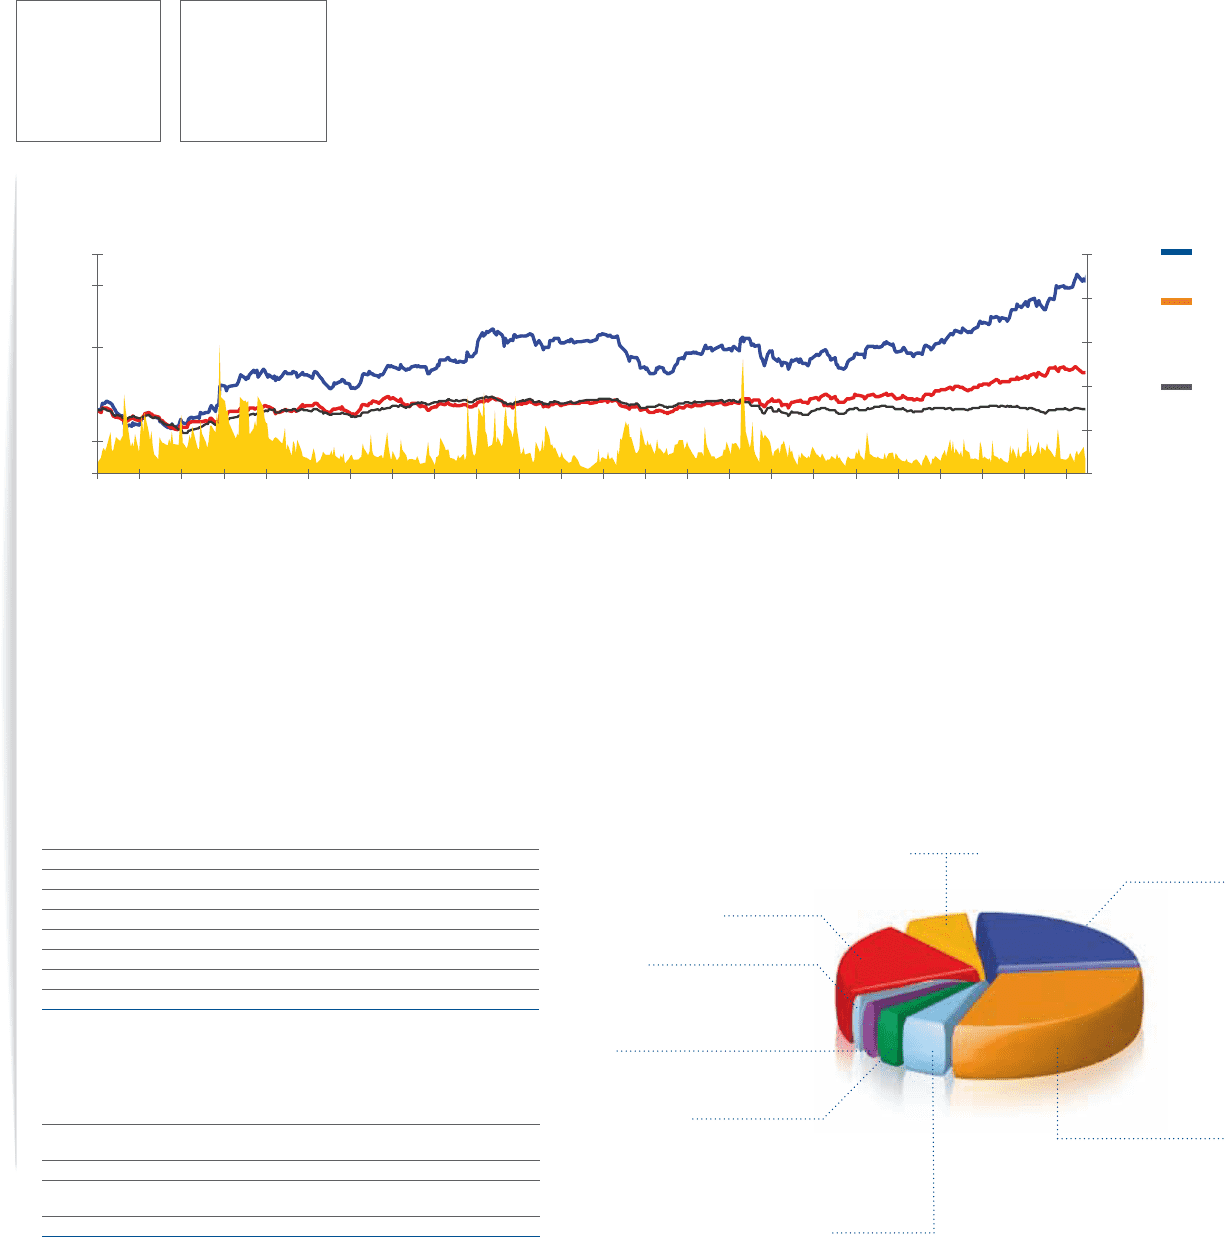
Following the crisis and market uncertainties of the previous year, 2010 was a positive year for the equity markets, although performance varied significantly
from market to market. In the United States, the year closed positively with the Dow Jones up around 11%: despite problems relating to public sector
spending and the sustainability of the financial system, major American corporates recorded strong earnings. Performance was also strong in Asia and for
emerging markets in general, although some Asian markets sustained losses for the year (Shanghai -14%, Tokyo -3%). Of the three major economic blocks,
Europe underperformed once again, reflecting concerns over the sovereign debt issues of some smaller European states and the pace of its economic
recovery relative to other regions. Also in Europe, there were major differences between markets: Frankfurt gained around 16% for the year, while double-
digit losses were recorded for the FTSE Italia (down around 13%) and the Madrid stock exchange (approx. 17% decline), and Paris closed the year down
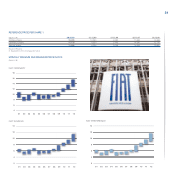
around 3%. During this period, Fiat shares gained 50.5% over the closing price for 2009 and outperformed the DJ Euro Stoxx Automotive index by 42.8%.
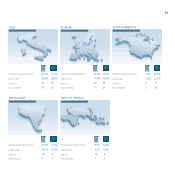
MAJOR SHAREHOLDERS
At the date of this Report, Fiat had a total of 1,092,247,485 ordinary shares
outstanding and the following institutions held more than 2% of ordinary shares:
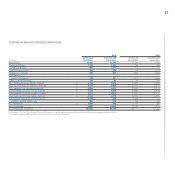
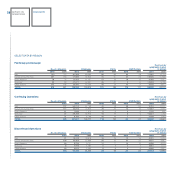
(figures in €) 2010 2009 2008 2007
Basic earnings/(loss)
per ordinary and preference share 0.410 (0.677) 1.290 1.537
Basic earnings/(loss) per savings share 0.565 (0.677) 1.445 1.692
Diluted earnings/(loss)
per ordinary and preference share 0.409 (0.677) 1.285 1.526
Diluted earnings/(loss) per savings share 0.564 (0.677) 1.440 1.681
EARNINGS PER SHARE
Exor S.p.A.
30.5%
Capital Research
& Management Co.
5.2%
FMR LLC
2.2%
Other shareholders
24.5%
Other institutional investors –
outside EU
8.0%
BlackRock Investment
Management (UK)
Limited
3.1%
John Griffin
(through
Blue Ridge Capital)
2.4%
Exor S.p.A. (*) 30.5%
Capital Research & Management Company 5.2%
BlackRock Investment Management (UK) Limited 3.1%
John Griffin (through Blue Ridge Capital) 2.4%
FMR LLC 2.2%
Other institutional investors – EU 20.6%
Other institutional investors – outside EU 8.0%
Other shareholders 24.5%
(*) In addition to 3.5% of ordinary shares held by Fiat S.p.A.
ORDINARY SHARES: 1,092,247,485
Other institutional
investors – EU
20.6%
FIAT ORDINARY SHARES – 1/1/2009 TO 31/12/2010
PERFORMANCE RELATIVE TO FTSE ITALIA ALL SHARE AND EUROSTOXX INDEXES (REBASED TO 100: 01/01/2009)
AND AVERAGE MONTHLY TRADING VOLUME (MILLIONS OF ORD. SHARES)
FIAT
FTSE ITALIA
ALL SHARE
DJ
EUROSTOXX
AUTOMOTIVE
350
300
250
200
150
100
50
250
200
150
100
50
millions of shares
Jan-
09
Feb-
09
Mar-
09
Apr-
09
May-
09
Jun-
09
Jul-
09
Aug-
09
Sep-
09
Oct-
09
Nov-
09
Dec-
09
Jan-
10
Feb-
10
Mar-
10
Apr-
10
May-
10
Jun-
10
Jul-
10
Aug-
10
Sep-
10
Oct-
10
Nov-
10
Dec-
10