Chrysler 2010 Annual Report Download - page 193
Download and view the complete annual report
Please find page 193 of the 2010 Chrysler annual report below. You can navigate through the pages in the report by either clicking on the pages listed below, or by using the keyword search tool below to find specific information within the annual report.-
 1
1 -
2
-
3
-
4
-
5
-
6
-
7
-
8
-
9
-
10
-
11
-
12
-
13
-
14
-
15
-
16
-
17
-
18
-
19
-
20
-
21
-
22
-
23
-
24
-
25
-
26
-
27
-
28
-
29
-
30
-
31
-
32
-
33
-
34
-
35
-
36
-
37
-
38
-
39
-
40
-
41
-
42
-
43
-
44
-
45
-
46
-
47
-
48
-
49
-
50
-
51
-
52
-
53
-
54
-
55
-
56
-
57
-
58
-
59
-
60
-
61
-
62
-
63
-
64
-
65
-
66
-
67
-
68
-
69
-
70
-
71
-
72
-
73
-
74
-
75
-
76
-
77
-
78
-
79
-
80
-
81
-
82
-
83
-
84
-
85
-
86
-
87
-
88
-
89
-
90
-
91
-
92
-
93
-
94
-
95
-
96
-
97
-
98
-
99
-
100
-
101
-
102
-
103
-
104
-
105
-
106
-
107
-
108
-
109
-
110
-
111
-
112
-
113
-
114
-
115
-
116
-
117
-
118
-
119
-
120
-
121
-
122
-
123
-
124
-
125
-
126
-
127
-
128
-
129
-
130
-
131
-
132
-
133
-
134
-
135
-
136
-
137
-
138
-
139
-
140
-
141
-
142
-
143
-
144
-
145
-
146
-
147
-
148
-
149
-
150
-
151
-
152
-
153
-
154
-
155
-
156
-
157
-
158
-
159
-
160
-
161
-
162
-
163
-
164
-
165
-
166
-
167
-
168
-
169
-
170
-
171
-
172
-
173
-
174
-
175
-
176
-
177
-
178
-
179
-
180
-
181
-
182
-
 183
183 -
 184
184 -
 185
185 -
 186
186 -
 187
187 -
 188
188 -
 189
189 -
 190
190 -
 191
191 -
 192
192 -
 193
193 -
 194
194 -
 195
195 -
 196
196 -
 197
197 -
 198
198 -
 199
199 -
 200
200 -
 201
201 -
 202
202 -
 203
203 -
204
-
205
-
206
-
207
-
208
-
209
-
210
-
211
-
212
-
213
-
214
-
215
-
216
-
217
-
218
-
219
-
220
-
221
-
222
-
223
-
224
-
225
-
226
-
227
-
228
-
229
-
230
-
231
-
232
-
233
-
234
-
235
-
236
-
237
-
238
-
239
-
240
-
241
-
242
-
243
-
244
-
245
-
246
-
247
-
248
-
249
-
250
-
251
-
252
-
253
-
254
-
255
-
256
-
257
-
258
-
259
-
260
-
261
-
262
-
263
-
264
-
265
-
266
-
267
-
268
-
269
-
270
-
271
-
272
-
273
-
274
-
275
-
276
-
277
-
278
-
279
-
280
-
281
-
282
-
283
-
284
-
285
-
286
-
287
-
288
-
289
-
290
-
291
-
292
-
293
-
294
-
295
-
296
-
297
-
298
-
299
-
300
-
301
-
302
-
303
-
304
-
305
-
306
-
307
-
308
-
309
-
310
-
311
-
312
-
313
-
314
-
315
-
316
-
317
-
318
-
319
-
320
-
321
-
322
-
323
-
324
-
325
-
326
-
327
-
328
-
329
-
330
-
331
-
332
-
333
-
334
-
335
-
336
-
337
-
338
-
339
-
340
-
341
-
342
-
343
-
344
-
345
-
346
-
347
-
348
-
349
-
350
-
351
-
352
-
353
-
354
-
355
-
356
-
357
-
358
-
359
-
360
-
361
-
362
-
363
-
364
-
365
-
366
-
367
-
368
-
369
-
370
-
371
-
372
-
373
-
374
-
375
-
376
-
377
-
378
-
379
-
380
-
381
-
382
-
383
-
384
-
385
-
386
-
387
-
388
-
389
-
390
-
391
-
392
-
393
-
394
-
395
-
396
-
397
-
398
-
399
-
400
-
401
-
402
 |
 |

FIAT GROUP
CONSOLIDATED
FINANCIAL
STATEMENTS
AT 31 DECEMBER
2010
NOTES
192
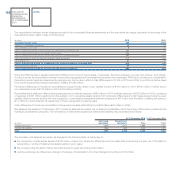
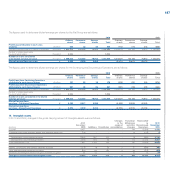
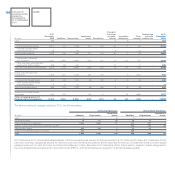
A terminal value is included at the end of the projection period used in the discounted cash flow analyses in order to reflect the remaining value that each
cash-generating unit is expected to generate. The terminal value represents the present value in the last year of the projection period of all subsequent cash
flows into perpetuity. The terminal value growth rate is a key assumption used in determining the terminal value as it represents the annual growth of all
subsequent cash flows into perpetuity. The terminal value growth rate selected in 2010 and 2009 for the Agricultural equipment cash-generating unit was
1% and that selected for the Construction equipment cash generating unit was 2%.
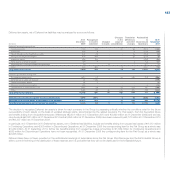
The total asset market multiples were utilised in determining the fair value of the Financial Services reporting unit under the market approach. CNH used the
market approach as the primary approach to measure the fair value of the Financial Services reporting unit as it derives value based primarily on the assets
under management. The market approach measures fair value based on prices and other relevant information generated by market transactions involving
identical or comparable assets or liabilities. Under this approach, CNH makes use of market price data of corporations whose stock is actively traded in a
public, free and open market, either on an exchange or over-the counter basis. Although it is clear that no two companies are entirely alike, the corporations
selected as guideline companies must be engaged in the same or similar line of business or be subject to similar financial and business risks, including the
opportunity for growth.
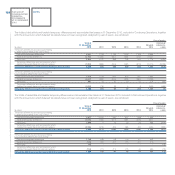
Revenue and EBITDA market multiples were utilised in determining the fair value of the Equipment Operations cash generating units as a secondary
approach to further supporting the discounted cash flow approach. Because the market approach does not evaluate the CNH cash generating units’
projected cash flows, sector management believes the market approach enables verification of the implied multiples derived from the discounted cash flows
approach using market benchmarks. CNH management identified comparable companies by reviewing all publicly traded companies operating in the CNH
lines of business. The comparable companies used were determined based on an evaluation of all relevant factors, including whether the companies were
subject to similar financial and business risks.
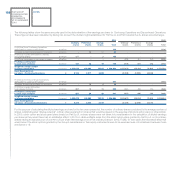
The fair values of each of the three cash-generating units calculated using the above methods in any case exceeded their carrying amounts and their values
determined using the discounted cash flow method at 31 December 2010.
The results obtained for the Trucks and Commercial Vehicles sector and related sensitivity analyses also confirmed the absence of significant
impairment losses.
Finally, the estimates and budget data to which the above mentioned parameters have been applied are those determined by management based on past
performance and expectations of developments in the markets in which the Group operates. Estimating the recoverable amount of cash generating units
requires discretion and the use of estimates by management. The Group cannot guarantee that there will be no goodwill impairment in future periods.
Circumstances and events, which could potentially cause further impairment losses, are constantly monitored by the Fiat Industrial Group.
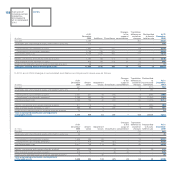
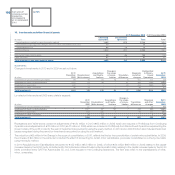
Development costs
The amortisation of development costs and impairment losses are reported in the income statement as Research and development costs.
Development costs recognised as assets are attributed to cash generating units and are tested for impairment together with the related tangible fixed assets,
using the discounted cash flow method for determining their recoverable amount.