Chrysler 2010 Annual Report Download - page 220
Download and view the complete annual report
Please find page 220 of the 2010 Chrysler annual report below. You can navigate through the pages in the report by either clicking on the pages listed below, or by using the keyword search tool below to find specific information within the annual report.-
 1
1 -
2
-
3
-
4
-
5
-
6
-
7
-
8
-
9
-
10
-
11
-
12
-
13
-
14
-
15
-
16
-
17
-
18
-
19
-
20
-
21
-
22
-
23
-
24
-
25
-
26
-
27
-
28
-
29
-
30
-
31
-
32
-
33
-
34
-
35
-
36
-
37
-
38
-
39
-
40
-
41
-
42
-
43
-
44
-
45
-
46
-
47
-
48
-
49
-
50
-
51
-
52
-
53
-
54
-
55
-
56
-
57
-
58
-
59
-
60
-
61
-
62
-
63
-
64
-
65
-
66
-
67
-
68
-
69
-
70
-
71
-
72
-
73
-
74
-
75
-
76
-
77
-
78
-
79
-
80
-
81
-
82
-
83
-
84
-
85
-
86
-
87
-
88
-
89
-
90
-
91
-
92
-
93
-
94
-
95
-
96
-
97
-
98
-
99
-
100
-
101
-
102
-
103
-
104
-
105
-
106
-
107
-
108
-
109
-
110
-
111
-
112
-
113
-
114
-
115
-
116
-
117
-
118
-
119
-
120
-
121
-
122
-
123
-
124
-
125
-
126
-
127
-
128
-
129
-
130
-
131
-
132
-
133
-
134
-
135
-
136
-
137
-
138
-
139
-
140
-
141
-
142
-
143
-
144
-
145
-
146
-
147
-
148
-
149
-
150
-
151
-
152
-
153
-
154
-
155
-
156
-
157
-
158
-
159
-
160
-
161
-
162
-
163
-
164
-
165
-
166
-
167
-
168
-
169
-
170
-
171
-
172
-
173
-
174
-
175
-
176
-
177
-
178
-
179
-
180
-
181
-
182
-
183
-
184
-
185
-
186
-
187
-
188
-
189
-
190
-
191
-
192
-
193
-
194
-
195
-
196
-
197
-
198
-
199
-
200
-
201
-
202
-
203
-
204
-
205
-
206
-
207
-
208
-
209
-
 210
210 -
 211
211 -
 212
212 -
 213
213 -
 214
214 -
 215
215 -
 216
216 -
 217
217 -
 218
218 -
 219
219 -
 220
220 -
 221
221 -
 222
222 -
 223
223 -
 224
224 -
 225
225 -
 226
226 -
 227
227 -
 228
228 -
 229
229 -
 230
230 -
231
-
232
-
233
-
234
-
235
-
236
-
237
-
238
-
239
-
240
-
241
-
242
-
243
-
244
-
245
-
246
-
247
-
248
-
249
-
250
-
251
-
252
-
253
-
254
-
255
-
256
-
257
-
258
-
259
-
260
-
261
-
262
-
263
-
264
-
265
-
266
-
267
-
268
-
269
-
270
-
271
-
272
-
273
-
274
-
275
-
276
-
277
-
278
-
279
-
280
-
281
-
282
-
283
-
284
-
285
-
286
-
287
-
288
-
289
-
290
-
291
-
292
-
293
-
294
-
295
-
296
-
297
-
298
-
299
-
300
-
301
-
302
-
303
-
304
-
305
-
306
-
307
-
308
-
309
-
310
-
311
-
312
-
313
-
314
-
315
-
316
-
317
-
318
-
319
-
320
-
321
-
322
-
323
-
324
-
325
-
326
-
327
-
328
-
329
-
330
-
331
-
332
-
333
-
334
-
335
-
336
-
337
-
338
-
339
-
340
-
341
-
342
-
343
-
344
-
345
-
346
-
347
-
348
-
349
-
350
-
351
-
352
-
353
-
354
-
355
-
356
-
357
-
358
-
359
-
360
-
361
-
362
-
363
-
364
-
365
-
366
-
367
-
368
-
369
-
370
-
371
-
372
-
373
-
374
-
375
-
376
-
377
-
378
-
379
-
380
-
381
-
382
-
383
-
384
-
385
-
386
-
387
-
388
-
389
-
390
-
391
-
392
-
393
-
394
-
395
-
396
-
397
-
398
-
399
-
400
-
401
-
402
 |
 |

219
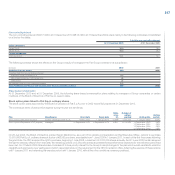
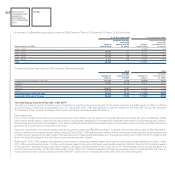
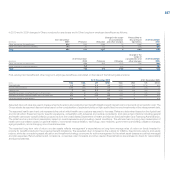
The contractual terms of the 2008 plan were as follows:
Strike price N° of options Vesting
Plan Beneficiary Expiry date (€) granted Vesting date portion
Stock Option July 2008 (forfeited) Managers 3 November 2014 10.24 1,418,500 1st Quarter 2009 (*) 18%*NMC
1st Quarter 2010 (*) 41%*NMC
1st Quarter 2011 (*) 41%*NMC
(*) On approval of the prior year’s consolidated financial statements; subject to continuation of the professional relationship.
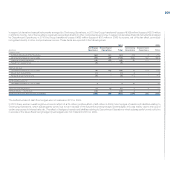
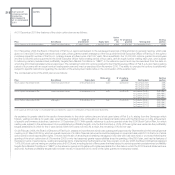
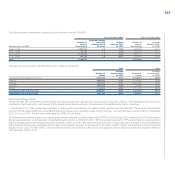
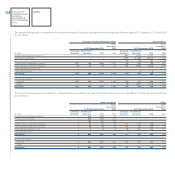
A summary of the terms of the stock option plans outstanding at 31 December 2010 is as follows:
Managers’ compensation Compensation as member of the Board
Options Options Average remaining Options Options Average remaining
Exercise outstanding at outstanding at contractual life outstanding at outstanding at contractual life
price (€) 31 December 2010 31 December 2009 (years) 31 December 2010 31 December 2009 (years)
6.583 - - - 10,670,000 10,670,000 5.0
10.24 - 956,530 - - - -
10.397 - 845,000 - - - -
12.699 - - - - 500,000 -
13.370 2,101,250 6,536,875 3.8 6,250,000 8,750,000 3.8
Total 2,101,250 8,338,405 16,920,000 19,920,000
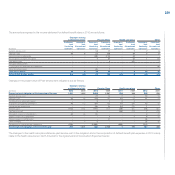
Changes during the year were as follows:
Managers’ compensation Compensation as member of the Board
Average exercise Average exercise
Number of options price (€) Number of options price (€)
Outstanding at the beginning of the year 8,338,405 12.71 19,920,000 9.72
Granted - - - -
Forfeited (5,447,155) 12.79 (2,500,000) 13.37
Exercised - - - -
Expired (790,000) 10.397 (500,000) 12.699
Outstanding at 31 December 2010 2,101,250 13.37 16,920,000 9.09
Exercisable at 31 December 2010 - - 5,000,000 13.37
Exercisable at 31 December 2009 845,000 10.397 500,000 12.699
The options forfeited during the year consist of unvested options regarding employees who have left the Group and options not vesting during the year due
to the fact that certain non-market conditions were not reached for the November 2006 and July 2008 plans.
The Group recognised a total nominal cost of €4.9 million in the 2010 income statement for plans outstanding at 31 December 2010 (net income of
€7 million in 2009 following the revision of the probability that subsequent tranches will vest).