Chrysler 2010 Annual Report Download - page 178
Download and view the complete annual report
Please find page 178 of the 2010 Chrysler annual report below. You can navigate through the pages in the report by either clicking on the pages listed below, or by using the keyword search tool below to find specific information within the annual report.-
 1
1 -
2
-
3
-
4
-
5
-
6
-
7
-
8
-
9
-
10
-
11
-
12
-
13
-
14
-
15
-
16
-
17
-
18
-
19
-
20
-
21
-
22
-
23
-
24
-
25
-
26
-
27
-
28
-
29
-
30
-
31
-
32
-
33
-
34
-
35
-
36
-
37
-
38
-
39
-
40
-
41
-
42
-
43
-
44
-
45
-
46
-
47
-
48
-
49
-
50
-
51
-
52
-
53
-
54
-
55
-
56
-
57
-
58
-
59
-
60
-
61
-
62
-
63
-
64
-
65
-
66
-
67
-
68
-
69
-
70
-
71
-
72
-
73
-
74
-
75
-
76
-
77
-
78
-
79
-
80
-
81
-
82
-
83
-
84
-
85
-
86
-
87
-
88
-
89
-
90
-
91
-
92
-
93
-
94
-
95
-
96
-
97
-
98
-
99
-
100
-
101
-
102
-
103
-
104
-
105
-
106
-
107
-
108
-
109
-
110
-
111
-
112
-
113
-
114
-
115
-
116
-
117
-
118
-
119
-
120
-
121
-
122
-
123
-
124
-
125
-
126
-
127
-
128
-
129
-
130
-
131
-
132
-
133
-
134
-
135
-
136
-
137
-
138
-
139
-
140
-
141
-
142
-
143
-
144
-
145
-
146
-
147
-
148
-
149
-
150
-
151
-
152
-
153
-
154
-
155
-
156
-
157
-
158
-
159
-
160
-
161
-
162
-
163
-
164
-
165
-
166
-
167
-
 168
168 -
 169
169 -
 170
170 -
 171
171 -
 172
172 -
 173
173 -
 174
174 -
 175
175 -
 176
176 -
 177
177 -
 178
178 -
 179
179 -
 180
180 -
 181
181 -
 182
182 -
 183
183 -
 184
184 -
 185
185 -
 186
186 -
 187
187 -
 188
188 -
189
-
190
-
191
-
192
-
193
-
194
-
195
-
196
-
197
-
198
-
199
-
200
-
201
-
202
-
203
-
204
-
205
-
206
-
207
-
208
-
209
-
210
-
211
-
212
-
213
-
214
-
215
-
216
-
217
-
218
-
219
-
220
-
221
-
222
-
223
-
224
-
225
-
226
-
227
-
228
-
229
-
230
-
231
-
232
-
233
-
234
-
235
-
236
-
237
-
238
-
239
-
240
-
241
-
242
-
243
-
244
-
245
-
246
-
247
-
248
-
249
-
250
-
251
-
252
-
253
-
254
-
255
-
256
-
257
-
258
-
259
-
260
-
261
-
262
-
263
-
264
-
265
-
266
-
267
-
268
-
269
-
270
-
271
-
272
-
273
-
274
-
275
-
276
-
277
-
278
-
279
-
280
-
281
-
282
-
283
-
284
-
285
-
286
-
287
-
288
-
289
-
290
-
291
-
292
-
293
-
294
-
295
-
296
-
297
-
298
-
299
-
300
-
301
-
302
-
303
-
304
-
305
-
306
-
307
-
308
-
309
-
310
-
311
-
312
-
313
-
314
-
315
-
316
-
317
-
318
-
319
-
320
-
321
-
322
-
323
-
324
-
325
-
326
-
327
-
328
-
329
-
330
-
331
-
332
-
333
-
334
-
335
-
336
-
337
-
338
-
339
-
340
-
341
-
342
-
343
-
344
-
345
-
346
-
347
-
348
-
349
-
350
-
351
-
352
-
353
-
354
-
355
-
356
-
357
-
358
-
359
-
360
-
361
-
362
-
363
-
364
-
365
-
366
-
367
-
368
-
369
-
370
-
371
-
372
-
373
-
374
-
375
-
376
-
377
-
378
-
379
-
380
-
381
-
382
-
383
-
384
-
385
-
386
-
387
-
388
-
389
-
390
-
391
-
392
-
393
-
394
-
395
-
396
-
397
-
398
-
399
-
400
-
401
-
402
 |
 |

177
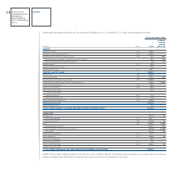
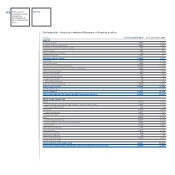
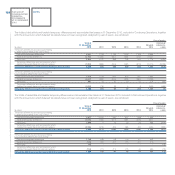
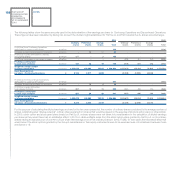
Fiat Industrial – Historical combined Statement of cash flows
(€ million) 2010 2009
A CASH AND CASH EQUIVALENTS AT BEGINNING OF THE YEAR 1,561 1,090
B) CASH FLOWS FROM (USED IN) OPERATING ACTIVITIES DURING THE YEAR:
Profit/(loss) 378 (503)
Amortisation and depreciation (net of vehicles sold under buy-back commitments and leased assets) 665 637
(Gains) losses on disposal of non-current assets and other non-cash items 192 254
Dividends received 32 18
Change in provisions 122 46
Change in deferred taxes 30 (123)
Change in items due to buy-back commitments 40 (35)
Change in operating lease items 26 (41)
Change in working capital 1,070 869
TOTAL 2,555 1,122
C) CASH FLOWS FROM (USED IN) INVESTING ACTIVITIES:
Investments in:
Property plant and equipment and intangible assets (net of vehicles
sold under buy-back commitments and leased assets) (872) (708)
Other investments (27) (5)
Proceeds from the sale of non-current assets 42 12
Net change in receivables from financing activities 335 1,120
Change in current securities 18 17
Other changes 76 (32)
TOTAL (428) 404
D) CASH FLOWS FROM (USED IN) FINANCING ACTIVITIES
New issuance of bonds 1,132 717
Repayment of bonds (377) (358)
Issuance of other medium-term borrowings 832 522
Repayment of other medium-term borrowings (830) (749)
Net change in other financial payables and other financial assets/liabilities 1,281 623
Net change in financial payables to post-Demerger Fiat Group (3,221) (1,622)
Increase in share capital 1,156 312
Dividends paid (93) (561)
TOTAL (120) (1,116)
Translation exchange differences 118 61
E) TOTAL CHANGE IN CASH AND CASH EQUIVALENTS 2,125 471
F) CASH AND CASH EQUIVALENTS AT END OF THE YEAR 3,686 1,561