Chrysler 2010 Annual Report Download - page 73
Download and view the complete annual report
Please find page 73 of the 2010 Chrysler annual report below. You can navigate through the pages in the report by either clicking on the pages listed below, or by using the keyword search tool below to find specific information within the annual report.-
 1
1 -
2
-
3
-
4
-
5
-
6
-
7
-
8
-
9
-
10
-
11
-
12
-
13
-
14
-
15
-
16
-
17
-
18
-
19
-
20
-
21
-
22
-
23
-
24
-
25
-
26
-
27
-
28
-
29
-
30
-
31
-
32
-
33
-
34
-
35
-
36
-
37
-
38
-
39
-
40
-
41
-
42
-
43
-
44
-
45
-
46
-
47
-
48
-
49
-
50
-
51
-
52
-
53
-
54
-
55
-
56
-
57
-
58
-
59
-
60
-
61
-
62
-
 63
63 -
 64
64 -
 65
65 -
 66
66 -
 67
67 -
 68
68 -
 69
69 -
 70
70 -
 71
71 -
 72
72 -
 73
73 -
 74
74 -
 75
75 -
 76
76 -
 77
77 -
 78
78 -
 79
79 -
 80
80 -
 81
81 -
 82
82 -
 83
83 -
84
-
85
-
86
-
87
-
88
-
89
-
90
-
91
-
92
-
93
-
94
-
95
-
96
-
97
-
98
-
99
-
100
-
101
-
102
-
103
-
104
-
105
-
106
-
107
-
108
-
109
-
110
-
111
-
112
-
113
-
114
-
115
-
116
-
117
-
118
-
119
-
120
-
121
-
122
-
123
-
124
-
125
-
126
-
127
-
128
-
129
-
130
-
131
-
132
-
133
-
134
-
135
-
136
-
137
-
138
-
139
-
140
-
141
-
142
-
143
-
144
-
145
-
146
-
147
-
148
-
149
-
150
-
151
-
152
-
153
-
154
-
155
-
156
-
157
-
158
-
159
-
160
-
161
-
162
-
163
-
164
-
165
-
166
-
167
-
168
-
169
-
170
-
171
-
172
-
173
-
174
-
175
-
176
-
177
-
178
-
179
-
180
-
181
-
182
-
183
-
184
-
185
-
186
-
187
-
188
-
189
-
190
-
191
-
192
-
193
-
194
-
195
-
196
-
197
-
198
-
199
-
200
-
201
-
202
-
203
-
204
-
205
-
206
-
207
-
208
-
209
-
210
-
211
-
212
-
213
-
214
-
215
-
216
-
217
-
218
-
219
-
220
-
221
-
222
-
223
-
224
-
225
-
226
-
227
-
228
-
229
-
230
-
231
-
232
-
233
-
234
-
235
-
236
-
237
-
238
-
239
-
240
-
241
-
242
-
243
-
244
-
245
-
246
-
247
-
248
-
249
-
250
-
251
-
252
-
253
-
254
-
255
-
256
-
257
-
258
-
259
-
260
-
261
-
262
-
263
-
264
-
265
-
266
-
267
-
268
-
269
-
270
-
271
-
272
-
273
-
274
-
275
-
276
-
277
-
278
-
279
-
280
-
281
-
282
-
283
-
284
-
285
-
286
-
287
-
288
-
289
-
290
-
291
-
292
-
293
-
294
-
295
-
296
-
297
-
298
-
299
-
300
-
301
-
302
-
303
-
304
-
305
-
306
-
307
-
308
-
309
-
310
-
311
-
312
-
313
-
314
-
315
-
316
-
317
-
318
-
319
-
320
-
321
-
322
-
323
-
324
-
325
-
326
-
327
-
328
-
329
-
330
-
331
-
332
-
333
-
334
-
335
-
336
-
337
-
338
-
339
-
340
-
341
-
342
-
343
-
344
-
345
-
346
-
347
-
348
-
349
-
350
-
351
-
352
-
353
-
354
-
355
-
356
-
357
-
358
-
359
-
360
-
361
-
362
-
363
-
364
-
365
-
366
-
367
-
368
-
369
-
370
-
371
-
372
-
373
-
374
-
375
-
376
-
377
-
378
-
379
-
380
-
381
-
382
-
383
-
384
-
385
-
386
-
387
-
388
-
389
-
390
-
391
-
392
-
393
-
394
-
395
-
396
-
397
-
398
-
399
-
400
-
401
-
402
 |
 |

REPORT ON
OPERATIONS
FINANCIAL
REVIEW –
FIAT GROUP
72
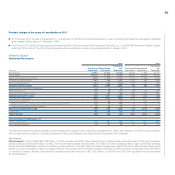
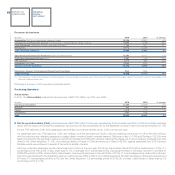
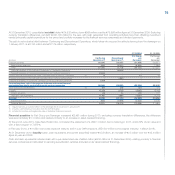
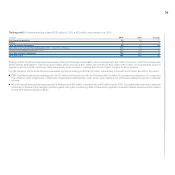
Following is a summary of the principal components of operating profit, broken down by sector:
Gains/(losses) on
Trading the disposal of Restructuring Other unusual Operating
profit/(loss) investments costs income/(expense) profit/(loss)
(€ million) 2010 2009 2010 2009 2010 2009 2010 2009 2010 2009
Fiat Group Automobiles 607 470 - - 90 54 (2) (199) 515 217
Maserati 24 11 - - - - - - 24 11
Ferrari 303 238 - 2 - - (1) 5 302 245
Fiat Powertrain 140 104 10 - (3) 21 19 (6) 172 77
Components (Magneti Marelli) 98 25 1 (3) 26 62 - - 73 (40)
Metallurgical Products (Teksid) 17 (12) - - - 4 - 2 17 (14)
Production Systems (Comau) (6) (28) - 1 - 5 - - (6) (32)
Other Businesses and Eliminations (71) (72) 1 3 5 22 (30) 5 (105) (86)
Total Continuing Operations 1,112 736 12 3 118 168 (14) (193) 992 378
Agricultural and Construction
Equipment (CNH) 755 337 4 1 5 87 - - 754 251
Trucks and Commercial Vehicles (Iveco) 270 105 - - 19 22 (11) (173) 240 (90)
FPT Industrial 65 (131) - - 33 35 (3) (25) 29 (191)
Eliminations and Other 2 11 (1) - 1 - (6) - (6) 11
Total Discontinued Operations 1,092 322 3 1 58 144 (20) (198) 1,017 (19)
Total Fiat Group 2,204 1,058 15 4 176 312 (34) (391) 2,009 359
Profit/(loss)
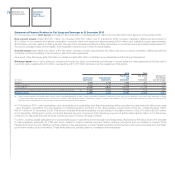
Net financial expense for 2010 totaled €905 million for the Group (€753 million for 2009) with the increase primarily due to the cost of maintaining
a higher level of liquidity. For Continuing Operations, net financial expense was €400 million (€352 million for 2009) and included a €111 million
gain in the mark-to-market value of two stock option-related equity swaps (a €117 million gain for 2009). For Discontinued Operations, net financial
expense totaled €505 million (€401 million for 2009).
Investment income totaled €178 million, up from the €27 million figure for 2009 mainly due an increase in earnings for joint venture companies.
For Continuing Operations, investment income totaled €114 million (€77 million in 2009). For Discontinued Operations, investment income was
€64 million (loss of €50 million in 2009).
Fiat Group recorded profit before taxes of €1,282 million (loss before taxes of €367 million for 2009), €706 million of which related to Continuing
Operations (profit before taxes of €103 million for 2009) and reflected the higher operating result (+€614 million), as well as an increase in investment
income (+€37 million), partially offset by a €48 million increase in net financial expense. Discontinued Operations closed 2010 with a profit before
taxes of €576 million, compared to a loss before taxes of €470 million for 2009. The increase reflects the higher operating result (+€1,036 million)
and an increase in investment income (+€114 million), partially offset by a €104 million increase in net financial expense.
Income taxes for 2010 for Fiat Group totaled €682 million (€481 million for 2009), of which €90 million for IRAP (€99 million for 2009) and €8 million for
taxes relating to prior periods (€24 million for 2009) with the remainder relating to the taxable income of companies operating outside Italy. For Continuing
Operations, income taxes totaled €484 million (€448 million for 2009) and for Discontinued Operations, they came to €198 million (€33 million for 2009).
For 2010, Fiat Group recorded a profit of €600 million (loss of €848 million for 2009), €222 million for Continuing Operations (loss of €345 million
for 2009) and €378 million for Discontinued Operations (loss of €503 million for 2009).
Profit attributable to owners of the parent for 2010 was €520 million (loss of €838 million for 2009), €179 million for Continuing Operations
(loss of €374 million for 2009) and €341 million for Discontinued Operations (loss of €464 million for 2009).