Chrysler 2010 Annual Report Download - page 69
Download and view the complete annual report
Please find page 69 of the 2010 Chrysler annual report below. You can navigate through the pages in the report by either clicking on the pages listed below, or by using the keyword search tool below to find specific information within the annual report.-
 1
1 -
 2
2 -
 3
3 -
 4
4 -
 5
5 -
 6
6 -
 7
7 -
 8
8 -
 9
9 -
 10
10 -
 11
11 -
 12
12 -
 13
13 -
 14
14 -
 15
15 -
 16
16 -
 17
17 -
 18
18 -
 19
19 -
 20
20 -
 21
21 -
 22
22 -
 23
23 -
 24
24 -
 25
25 -
 26
26 -
 27
27 -
 28
28 -
 29
29 -
 30
30 -
 31
31 -
 32
32 -
 33
33 -
 34
34 -
 35
35 -
 36
36 -
 37
37 -
 38
38 -
 39
39 -
 40
40 -
 41
41 -
 42
42 -
 43
43 -
 44
44 -
 45
45 -
 46
46 -
 47
47 -
 48
48 -
 49
49 -
 50
50 -
 51
51 -
 52
52 -
 53
53 -
 54
54 -
 55
55 -
 56
56 -
 57
57 -
 58
58 -
 59
59 -
 60
60 -
 61
61 -
 62
62 -
 63
63 -
 64
64 -
 65
65 -
 66
66 -
 67
67 -
 68
68 -
 69
69 -
 70
70 -
 71
71 -
 72
72 -
 73
73 -
 74
74 -
 75
75 -
 76
76 -
 77
77 -
 78
78 -
 79
79 -
 80
80 -
 81
81 -
 82
82 -
 83
83 -
 84
84 -
 85
85 -
 86
86 -
 87
87 -
 88
88 -
 89
89 -
 90
90 -
 91
91 -
 92
92 -
 93
93 -
 94
94 -
 95
95 -
 96
96 -
 97
97 -
 98
98 -
 99
99 -
 100
100 -
 101
101 -
 102
102 -
 103
103 -
 104
104 -
 105
105 -
 106
106 -
 107
107 -
 108
108 -
 109
109 -
 110
110 -
 111
111 -
 112
112 -
 113
113 -
 114
114 -
 115
115 -
 116
116 -
 117
117 -
 118
118 -
 119
119 -
 120
120 -
 121
121 -
 122
122 -
 123
123 -
 124
124 -
 125
125 -
 126
126 -
 127
127 -
 128
128 -
 129
129 -
 130
130 -
 131
131 -
 132
132 -
 133
133 -
 134
134 -
 135
135 -
 136
136 -
 137
137 -
 138
138 -
 139
139 -
 140
140 -
 141
141 -
 142
142 -
 143
143 -
 144
144 -
 145
145 -
 146
146 -
 147
147 -
 148
148 -
 149
149 -
 150
150 -
 151
151 -
 152
152 -
 153
153 -
 154
154 -
 155
155 -
 156
156 -
 157
157 -
 158
158 -
 159
159 -
 160
160 -
 161
161 -
 162
162 -
 163
163 -
 164
164 -
 165
165 -
 166
166 -
 167
167 -
 168
168 -
 169
169 -
 170
170 -
 171
171 -
 172
172 -
 173
173 -
 174
174 -
 175
175 -
 176
176 -
 177
177 -
 178
178 -
 179
179 -
 180
180 -
 181
181 -
 182
182 -
 183
183 -
 184
184 -
 185
185 -
 186
186 -
 187
187 -
 188
188 -
 189
189 -
 190
190 -
 191
191 -
 192
192 -
 193
193 -
 194
194 -
 195
195 -
 196
196 -
 197
197 -
 198
198 -
 199
199 -
 200
200 -
 201
201 -
 202
202 -
 203
203 -
 204
204 -
 205
205 -
 206
206 -
 207
207 -
 208
208 -
 209
209 -
 210
210 -
 211
211 -
 212
212 -
 213
213 -
 214
214 -
 215
215 -
 216
216 -
 217
217 -
 218
218 -
 219
219 -
 220
220 -
 221
221 -
 222
222 -
 223
223 -
 224
224 -
 225
225 -
 226
226 -
 227
227 -
 228
228 -
 229
229 -
 230
230 -
 231
231 -
 232
232 -
 233
233 -
 234
234 -
 235
235 -
 236
236 -
 237
237 -
 238
238 -
 239
239 -
 240
240 -
 241
241 -
 242
242 -
 243
243 -
 244
244 -
 245
245 -
 246
246 -
 247
247 -
 248
248 -
 249
249 -
 250
250 -
 251
251 -
 252
252 -
 253
253 -
 254
254 -
 255
255 -
 256
256 -
 257
257 -
 258
258 -
 259
259 -
 260
260 -
 261
261 -
 262
262 -
 263
263 -
 264
264 -
 265
265 -
 266
266 -
 267
267 -
 268
268 -
 269
269 -
 270
270 -
 271
271 -
 272
272 -
 273
273 -
 274
274 -
 275
275 -
 276
276 -
 277
277 -
 278
278 -
 279
279 -
 280
280 -
 281
281 -
 282
282 -
 283
283 -
 284
284 -
 285
285 -
 286
286 -
 287
287 -
 288
288 -
 289
289 -
 290
290 -
 291
291 -
 292
292 -
 293
293 -
 294
294 -
 295
295 -
 296
296 -
 297
297 -
 298
298 -
 299
299 -
 300
300 -
 301
301 -
 302
302 -
 303
303 -
 304
304 -
 305
305 -
 306
306 -
 307
307 -
 308
308 -
 309
309 -
 310
310 -
 311
311 -
 312
312 -
 313
313 -
 314
314 -
 315
315 -
 316
316 -
 317
317 -
 318
318 -
 319
319 -
 320
320 -
 321
321 -
 322
322 -
 323
323 -
 324
324 -
 325
325 -
 326
326 -
 327
327 -
 328
328 -
 329
329 -
 330
330 -
 331
331 -
 332
332 -
 333
333 -
 334
334 -
 335
335 -
 336
336 -
 337
337 -
 338
338 -
 339
339 -
 340
340 -
 341
341 -
 342
342 -
 343
343 -
 344
344 -
 345
345 -
 346
346 -
 347
347 -
 348
348 -
 349
349 -
 350
350 -
 351
351 -
 352
352 -
 353
353 -
 354
354 -
 355
355 -
 356
356 -
 357
357 -
 358
358 -
 359
359 -
 360
360 -
 361
361 -
 362
362 -
 363
363 -
 364
364 -
 365
365 -
 366
366 -
 367
367 -
 368
368 -
 369
369 -
 370
370 -
 371
371 -
 372
372 -
 373
373 -
 374
374 -
 375
375 -
 376
376 -
 377
377 -
 378
378 -
 379
379 -
 380
380 -
 381
381 -
 382
382 -
 383
383 -
 384
384 -
 385
385 -
 386
386 -
 387
387 -
 388
388 -
 389
389 -
 390
390 -
 391
391 -
 392
392 -
 393
393 -
 394
394 -
 395
395 -
 396
396 -
 397
397 -
 398
398 -
 399
399 -
 400
400 -
 401
401 -
 402
402
 |
 |

REPORT ON
OPERATIONS
FINANCIAL
REVIEW –
FIAT GROUP
68
Other Businesses
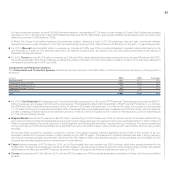
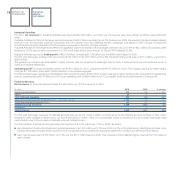
Other Businesses includes the contribution from the Group’s publishing businesses, service companies and holding companies. For 2010, Other
Businesses had revenues of €1,159 million, up 10.7% year-over-year.
Discontinued Operations
Agricultural and Construction Equipment
CNH – Case New Holland had revenues of €11,906 million for 2010, an increase of 17.8% over 2009 (+12% in US dollar terms) on the back of improving
agricultural and construction equipment demand in the Americas and Rest of World markets. Net sales in the Agricultural equipment segment increased
14% for the year (+8% in USD) as a result of solid trading conditions in the Americas due to increasing agricultural commodity prices and good harvest
conditions. Trading conditions in Europe were more difficult, largely due to poor harvest conditions in certain countries and tight credit markets. Full year
2010 net sales in the Construction equipment segment grew 46% (+39% in USD) as a result of significant market improvements in Latin America and Asia,
and improved conditions in North America largely due to replacement of ageing fleets.
In 2010, worldwide agricultural industry retail unit sales increased 8% compared to prior year with improvements in all regions except Western Europe.
Global sales grew 8% for tractors and 2% for combines. CNH full year global market share for tractors was largely in line with prior year, maintaining position
in Western Europe despite the industry decline and with a slight decrease in North America in under 40 hp and mid-sized utility tractors while transitioning
to new and more competitive products. CNH improved its global market share for combines on strong performance in the Rest of World regions.
Global construction equipment industry unit sales rose 47% in the year, off a low basis in 2009, with light equipment up 35% and heavy equipment up 59%.
CNH’s full year market share was in line with growth in demand across all segments and regions with the exception of Latin America, which was down due
to local manufacturing capacity constraints for CNH in both the heavy and light segments. Capacity expansion plans have been initiated at two facilities to
accommodate future market growth and in order to meet manufacturing localization targets.
Trucks and Commercial Vehicles
Iveco reported revenues of €8,307 million for the year, up 15.6% over 2009, primarily as a result of higher sales volumes, which reflect a general recovery
in demand, although remaining at modest levels in Western Europe.
Iveco delivered a total of 129,630 vehicles, an increase of 24.8% over 2009. Growth was recorded in all segments with light vehicles up 25.3%, medium up
51.3% and heavy up 27.6%. Total deliveries for 2010 were, however, still considerably below pre-crisis levels. In Western Europe, a total of 78,326 vehicles
were delivered (+17.3%), with increases in France (+22.3%), Germany (+31.9%), Spain (+40.8%) and the UK (+36.9%), but year-on-year performance for
Italy flat (-0.1%). The trend was positive in Eastern Europe, with deliveries up 41.6%, and very strong in Latin America, increasing 52.4%.
Iveco’s market share in Western Europe was 13.2% (down 0.4 percentage points vs. 2009). Share was substantially unchanged in the light segment
(-0.1 percentage points), with negative relative performance in the UK (-1.4 percentage points) offsetting increases in Spain and Germany (+1.7 and
+1.4 percentage points, respectively). Share in the medium segment was down 0.4 percentage points, despite improvements in Spain (+11.6 percentage
points), France (+1.0 percentage point) and Germany (+1.1 percentage points). Share decreased 0.9 percentage points in the heavy segment, with
negative performances in Spain (-8.1 percentage points) and Germany (-1.3 percentage points) partially compensated for by an increase in market share
for Italy (+2.1 percentage points).
FPT Industrial
For 2010, FPT Industrial (the Industrial & Marine business line of the former FPT Powertrain Technologies sector) reported €2,415 million in revenues,
representing an increase of 52.8% over the previous year driven by a strong increase in volumes. Sales to customers external to the Fiat Group as well as to
joint ventures accounted for 32.3% (32.6% in 2009). A total of 423,000 engines (+58.1%) were sold, primarily to Iveco (34%), CNH (23%) and Sevel (25%),
Fiat Group Automobiles’ JV for light commercial vehicles. In addition, 66,000 transmissions (+25.0%) and 139,000 axles (+32.1%) were also delivered.
