Chrysler 2010 Annual Report Download - page 230
Download and view the complete annual report
Please find page 230 of the 2010 Chrysler annual report below. You can navigate through the pages in the report by either clicking on the pages listed below, or by using the keyword search tool below to find specific information within the annual report.-
 1
1 -
2
-
3
-
4
-
5
-
6
-
7
-
8
-
9
-
10
-
11
-
12
-
13
-
14
-
15
-
16
-
17
-
18
-
19
-
20
-
21
-
22
-
23
-
24
-
25
-
26
-
27
-
28
-
29
-
30
-
31
-
32
-
33
-
34
-
35
-
36
-
37
-
38
-
39
-
40
-
41
-
42
-
43
-
44
-
45
-
46
-
47
-
48
-
49
-
50
-
51
-
52
-
53
-
54
-
55
-
56
-
57
-
58
-
59
-
60
-
61
-
62
-
63
-
64
-
65
-
66
-
67
-
68
-
69
-
70
-
71
-
72
-
73
-
74
-
75
-
76
-
77
-
78
-
79
-
80
-
81
-
82
-
83
-
84
-
85
-
86
-
87
-
88
-
89
-
90
-
91
-
92
-
93
-
94
-
95
-
96
-
97
-
98
-
99
-
100
-
101
-
102
-
103
-
104
-
105
-
106
-
107
-
108
-
109
-
110
-
111
-
112
-
113
-
114
-
115
-
116
-
117
-
118
-
119
-
120
-
121
-
122
-
123
-
124
-
125
-
126
-
127
-
128
-
129
-
130
-
131
-
132
-
133
-
134
-
135
-
136
-
137
-
138
-
139
-
140
-
141
-
142
-
143
-
144
-
145
-
146
-
147
-
148
-
149
-
150
-
151
-
152
-
153
-
154
-
155
-
156
-
157
-
158
-
159
-
160
-
161
-
162
-
163
-
164
-
165
-
166
-
167
-
168
-
169
-
170
-
171
-
172
-
173
-
174
-
175
-
176
-
177
-
178
-
179
-
180
-
181
-
182
-
183
-
184
-
185
-
186
-
187
-
188
-
189
-
190
-
191
-
192
-
193
-
194
-
195
-
196
-
197
-
198
-
199
-
200
-
201
-
202
-
203
-
204
-
205
-
206
-
207
-
208
-
209
-
210
-
211
-
212
-
213
-
214
-
215
-
216
-
217
-
218
-
219
-
 220
220 -
 221
221 -
 222
222 -
 223
223 -
 224
224 -
 225
225 -
 226
226 -
 227
227 -
 228
228 -
 229
229 -
 230
230 -
 231
231 -
 232
232 -
 233
233 -
 234
234 -
 235
235 -
 236
236 -
 237
237 -
 238
238 -
 239
239 -
 240
240 -
241
-
242
-
243
-
244
-
245
-
246
-
247
-
248
-
249
-
250
-
251
-
252
-
253
-
254
-
255
-
256
-
257
-
258
-
259
-
260
-
261
-
262
-
263
-
264
-
265
-
266
-
267
-
268
-
269
-
270
-
271
-
272
-
273
-
274
-
275
-
276
-
277
-
278
-
279
-
280
-
281
-
282
-
283
-
284
-
285
-
286
-
287
-
288
-
289
-
290
-
291
-
292
-
293
-
294
-
295
-
296
-
297
-
298
-
299
-
300
-
301
-
302
-
303
-
304
-
305
-
306
-
307
-
308
-
309
-
310
-
311
-
312
-
313
-
314
-
315
-
316
-
317
-
318
-
319
-
320
-
321
-
322
-
323
-
324
-
325
-
326
-
327
-
328
-
329
-
330
-
331
-
332
-
333
-
334
-
335
-
336
-
337
-
338
-
339
-
340
-
341
-
342
-
343
-
344
-
345
-
346
-
347
-
348
-
349
-
350
-
351
-
352
-
353
-
354
-
355
-
356
-
357
-
358
-
359
-
360
-
361
-
362
-
363
-
364
-
365
-
366
-
367
-
368
-
369
-
370
-
371
-
372
-
373
-
374
-
375
-
376
-
377
-
378
-
379
-
380
-
381
-
382
-
383
-
384
-
385
-
386
-
387
-
388
-
389
-
390
-
391
-
392
-
393
-
394
-
395
-
396
-
397
-
398
-
399
-
400
-
401
-
402
 |
 |

229
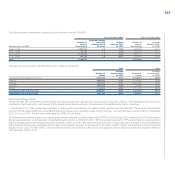
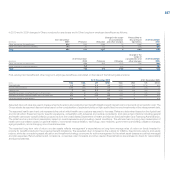
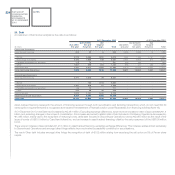
The amounts recognised in the income statement for defined benefit plans in 2010 are as follows:
Employee leaving
entitlements in Italy Pension Plans Health care plans Other
Profit/(loss) Profit/(loss) Profit/(loss) Profit/(loss) Profit/(loss) Profit/(loss) Profit/(loss) Profit/(loss)
from from from from from from from from
Continuing Discontinued Continuing Discontinued Continuing Discontinued Continuing Discontinued
(€ million) Operations Operations Operations Operations Operations Operations Operations Operations
Current service cost - - 10 17 - 7 7 8
Interest costs 26 6 25 120 - 44 5 6
Expected return on plan assets - - (20) (115) - (4) - -
Net actuarial losses (gains) recognised - - 3 27 - (2) 1 (1)
Past service costs - - - 3 - (41) - 1
Paragraph 58 adjustment - - - - - - - -
Losses (gains) on curtailments and settlements - - - - - - - (4)
Other (income) losses - - (2) 1 - - - -
Total Costs (gains) 26 6 16 53 - 4 13 10
Actual return on plan assets n/a n/a 22 150 n/a 6 n/a n/a
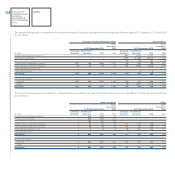
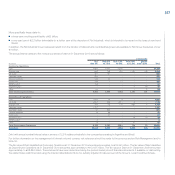
Changes in the present value of Post-employment obligations are as follows:
Employee leaving
entitlements in Italy Pension Plans Health care plans Other
(€ million) 2010 2009 2010 2009 2010 2009 2010 2009
Present value of obligation at the beginning of the year 1,001 1,062 2,568 2,267 794 848 258 288
Current service cost - - 27 23 7 6 15 13
Interest costs 32 55 145 142 44 52 11 14
Contribution by plan participants - - 3 4 4 3 - -
Actuarial losses (gains) generated 45 (17) 181 255 43 (36) 13 (2)
Exchange rate differences - - 128 36 64 (23) 1 -
Benefits paid (113) (102) (171) (161) (59) (51) (32) (31)
Past service cost - - 3 - (38) (10) 7 (19)
Change in scope of consolidation 44 (2) 21 - - - 4 (1)
(Gains) Losses on curtailments - - - 4 - 4 4 (2)
(Gains) Losses on settlements - - - (2) - - (2) -
Other changes - 5 2 - - 1 (1) (2)
Reclassified to Discontinued Operations (198) - (2,385) - (858) - (151) -
Present value of obligation at the end of the year 811 1,001 522 2,568 1 794 127 258
The changes to the health care plans stated as past service cost in the obligation and in the composition of defined benefit plan expenses in 2010 mainly
relate to the health care plans in North America for the Agricultural and Construction Equipment sector.