Chrysler 2010 Annual Report Download - page 123
Download and view the complete annual report
Please find page 123 of the 2010 Chrysler annual report below. You can navigate through the pages in the report by either clicking on the pages listed below, or by using the keyword search tool below to find specific information within the annual report.-
 1
1 -
2
-
3
-
4
-
5
-
6
-
7
-
8
-
9
-
10
-
11
-
12
-
13
-
14
-
15
-
16
-
17
-
18
-
19
-
20
-
21
-
22
-
23
-
24
-
25
-
26
-
27
-
28
-
29
-
30
-
31
-
32
-
33
-
34
-
35
-
36
-
37
-
38
-
39
-
40
-
41
-
42
-
43
-
44
-
45
-
46
-
47
-
48
-
49
-
50
-
51
-
52
-
53
-
54
-
55
-
56
-
57
-
58
-
59
-
60
-
61
-
62
-
63
-
64
-
65
-
66
-
67
-
68
-
69
-
70
-
71
-
72
-
73
-
74
-
75
-
76
-
77
-
78
-
79
-
80
-
81
-
82
-
83
-
84
-
85
-
86
-
87
-
88
-
89
-
90
-
91
-
92
-
93
-
94
-
95
-
96
-
97
-
98
-
99
-
100
-
101
-
102
-
103
-
104
-
105
-
106
-
107
-
108
-
109
-
110
-
111
-
112
-
 113
113 -
 114
114 -
 115
115 -
 116
116 -
 117
117 -
 118
118 -
 119
119 -
 120
120 -
 121
121 -
 122
122 -
 123
123 -
 124
124 -
 125
125 -
 126
126 -
 127
127 -
 128
128 -
 129
129 -
 130
130 -
 131
131 -
 132
132 -
 133
133 -
134
-
135
-
136
-
137
-
138
-
139
-
140
-
141
-
142
-
143
-
144
-
145
-
146
-
147
-
148
-
149
-
150
-
151
-
152
-
153
-
154
-
155
-
156
-
157
-
158
-
159
-
160
-
161
-
162
-
163
-
164
-
165
-
166
-
167
-
168
-
169
-
170
-
171
-
172
-
173
-
174
-
175
-
176
-
177
-
178
-
179
-
180
-
181
-
182
-
183
-
184
-
185
-
186
-
187
-
188
-
189
-
190
-
191
-
192
-
193
-
194
-
195
-
196
-
197
-
198
-
199
-
200
-
201
-
202
-
203
-
204
-
205
-
206
-
207
-
208
-
209
-
210
-
211
-
212
-
213
-
214
-
215
-
216
-
217
-
218
-
219
-
220
-
221
-
222
-
223
-
224
-
225
-
226
-
227
-
228
-
229
-
230
-
231
-
232
-
233
-
234
-
235
-
236
-
237
-
238
-
239
-
240
-
241
-
242
-
243
-
244
-
245
-
246
-
247
-
248
-
249
-
250
-
251
-
252
-
253
-
254
-
255
-
256
-
257
-
258
-
259
-
260
-
261
-
262
-
263
-
264
-
265
-
266
-
267
-
268
-
269
-
270
-
271
-
272
-
273
-
274
-
275
-
276
-
277
-
278
-
279
-
280
-
281
-
282
-
283
-
284
-
285
-
286
-
287
-
288
-
289
-
290
-
291
-
292
-
293
-
294
-
295
-
296
-
297
-
298
-
299
-
300
-
301
-
302
-
303
-
304
-
305
-
306
-
307
-
308
-
309
-
310
-
311
-
312
-
313
-
314
-
315
-
316
-
317
-
318
-
319
-
320
-
321
-
322
-
323
-
324
-
325
-
326
-
327
-
328
-
329
-
330
-
331
-
332
-
333
-
334
-
335
-
336
-
337
-
338
-
339
-
340
-
341
-
342
-
343
-
344
-
345
-
346
-
347
-
348
-
349
-
350
-
351
-
352
-
353
-
354
-
355
-
356
-
357
-
358
-
359
-
360
-
361
-
362
-
363
-
364
-
365
-
366
-
367
-
368
-
369
-
370
-
371
-
372
-
373
-
374
-
375
-
376
-
377
-
378
-
379
-
380
-
381
-
382
-
383
-
384
-
385
-
386
-
387
-
388
-
389
-
390
-
391
-
392
-
393
-
394
-
395
-
396
-
397
-
398
-
399
-
400
-
401
-
402
 |
 |

REPORT ON
OPERATIONS
122
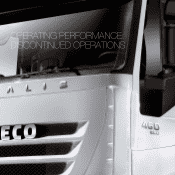
OPERATING
PERFORMANCE:
DISCONTINUED
OPERATIONS
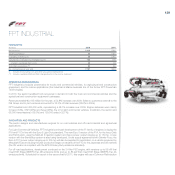
TRUCKS AND COMMERCIAL VEHICLES
Iveco
HIGHLIGHTS
(€ million) 2010 2009
Net revenues 8,307 7,183
Trading profit/(loss) 270 105
Operating profit/(loss) (*) 240 (90)
Investments in tangible and intangible assets (**) 273 217
of which capitalized R&D costs 138 84
Total R&D expenditure (***) 214 169
No. of employees at year end (numero) 25,583 24,917
(*) Includes restructuring costs and other unusual income/(expense)
(**) Net of vehicles sold under buy-back commitments and leased out
(***) Includes capitalized R&D and R&D charged directly to the income statement
COMMERCIAL PERFORMANCE
Following the sharp contraction experienced in 2009, demand in Western Europe for trucks and commercial
vehicles (Gross Vehicle Weight or “GVW” ≥ 3.5 tons) increased 6.3% to 528,757 units, driven by a recovery in
almost all major markets, except Italy (-3.2%), with Spain up 5.9%, the UK 9.2%, France 5.2% and Germany
rising 15.7%.
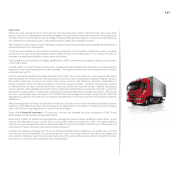
The light segment (GVW 3.5-6 tons) saw a 9.0% improvement over 2009, with significant gains in the UK
(+14.9%), Germany (+11.1%) and France (+10.3%). Italy was down 2.3%.
Demand in the medium segment (GVW 6.1-15.9 tons) contracted 1.5% over 2009. Declines in Spain (-8.9%),
the UK (-17.1%), Italy (-11.0%) and France (-15.0%) were partially offset by the strong performance in Germany,
which was up 18.4% over the prior year.
For the heavy segment (GVW ≥ 16 tons), the market improved 3.5% year-over-year driven by a recovery in
demand in the second half. Spain (+21.6%), Germany (+22.6%) and the UK (+5.0%) all ended the year up over
2009 levels, while Italy (-3.6%) and France (-1.8%) recorded declines.
For Eastern Europe (GVW ≥ 3.5 tons), market demand totaled 55,749 units for 2010, increasing 13.5%
year-over-year. The light and medium segments again registered a contraction for the full year, down 1.9% and
0.6% respectively, despite improved demand toward the end of the year. Only the heavy segment (GVW ≥ 16
tons) recorded a significant reversal in trend, improving 47.0% over the previous year as demand recovered in
several key markets: Poland (+45.7%), Romania (+37.3%) and the Czech Republic (+37.6%).
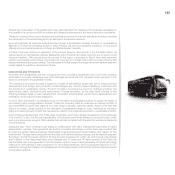
For buses, demand in Western Europe, totaling 32,288 units, was down 8.9% over 2009 on the back of
declines in all segments: Citybus (-13.5%), Intercity & Coach (-6.0%), Minibus & Truck Derived (-7.2%). Demand
for buses decreased in all Western European markets, with the exception of Italy, which was up 23.5% mainly
due to sustained demand for urban vehicles.