Chrysler 2010 Annual Report Download - page 304
Download and view the complete annual report
Please find page 304 of the 2010 Chrysler annual report below. You can navigate through the pages in the report by either clicking on the pages listed below, or by using the keyword search tool below to find specific information within the annual report.-
 1
1 -
2
-
3
-
4
-
5
-
6
-
7
-
8
-
9
-
10
-
11
-
12
-
13
-
14
-
15
-
16
-
17
-
18
-
19
-
20
-
21
-
22
-
23
-
24
-
25
-
26
-
27
-
28
-
29
-
30
-
31
-
32
-
33
-
34
-
35
-
36
-
37
-
38
-
39
-
40
-
41
-
42
-
43
-
44
-
45
-
46
-
47
-
48
-
49
-
50
-
51
-
52
-
53
-
54
-
55
-
56
-
57
-
58
-
59
-
60
-
61
-
62
-
63
-
64
-
65
-
66
-
67
-
68
-
69
-
70
-
71
-
72
-
73
-
74
-
75
-
76
-
77
-
78
-
79
-
80
-
81
-
82
-
83
-
84
-
85
-
86
-
87
-
88
-
89
-
90
-
91
-
92
-
93
-
94
-
95
-
96
-
97
-
98
-
99
-
100
-
101
-
102
-
103
-
104
-
105
-
106
-
107
-
108
-
109
-
110
-
111
-
112
-
113
-
114
-
115
-
116
-
117
-
118
-
119
-
120
-
121
-
122
-
123
-
124
-
125
-
126
-
127
-
128
-
129
-
130
-
131
-
132
-
133
-
134
-
135
-
136
-
137
-
138
-
139
-
140
-
141
-
142
-
143
-
144
-
145
-
146
-
147
-
148
-
149
-
150
-
151
-
152
-
153
-
154
-
155
-
156
-
157
-
158
-
159
-
160
-
161
-
162
-
163
-
164
-
165
-
166
-
167
-
168
-
169
-
170
-
171
-
172
-
173
-
174
-
175
-
176
-
177
-
178
-
179
-
180
-
181
-
182
-
183
-
184
-
185
-
186
-
187
-
188
-
189
-
190
-
191
-
192
-
193
-
194
-
195
-
196
-
197
-
198
-
199
-
200
-
201
-
202
-
203
-
204
-
205
-
206
-
207
-
208
-
209
-
210
-
211
-
212
-
213
-
214
-
215
-
216
-
217
-
218
-
219
-
220
-
221
-
222
-
223
-
224
-
225
-
226
-
227
-
228
-
229
-
230
-
231
-
232
-
233
-
234
-
235
-
236
-
237
-
238
-
239
-
240
-
241
-
242
-
243
-
244
-
245
-
246
-
247
-
248
-
249
-
250
-
251
-
252
-
253
-
254
-
255
-
256
-
257
-
258
-
259
-
260
-
261
-
262
-
263
-
264
-
265
-
266
-
267
-
268
-
269
-
270
-
271
-
272
-
273
-
274
-
275
-
276
-
277
-
278
-
279
-
280
-
281
-
282
-
283
-
284
-
285
-
286
-
287
-
288
-
289
-
290
-
291
-
292
-
293
-
 294
294 -
 295
295 -
 296
296 -
 297
297 -
 298
298 -
 299
299 -
 300
300 -
 301
301 -
 302
302 -
 303
303 -
 304
304 -
 305
305 -
 306
306 -
 307
307 -
 308
308 -
 309
309 -
 310
310 -
 311
311 -
 312
312 -
 313
313 -
 314
314 -
315
-
316
-
317
-
318
-
319
-
320
-
321
-
322
-
323
-
324
-
325
-
326
-
327
-
328
-
329
-
330
-
331
-
332
-
333
-
334
-
335
-
336
-
337
-
338
-
339
-
340
-
341
-
342
-
343
-
344
-
345
-
346
-
347
-
348
-
349
-
350
-
351
-
352
-
353
-
354
-
355
-
356
-
357
-
358
-
359
-
360
-
361
-
362
-
363
-
364
-
365
-
366
-
367
-
368
-
369
-
370
-
371
-
372
-
373
-
374
-
375
-
376
-
377
-
378
-
379
-
380
-
381
-
382
-
383
-
384
-
385
-
386
-
387
-
388
-
389
-
390
-
391
-
392
-
393
-
394
-
395
-
396
-
397
-
398
-
399
-
400
-
401
-
402
 |
 |

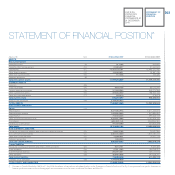
303
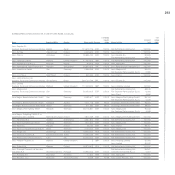
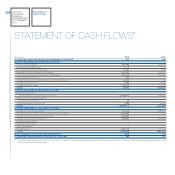
(figures in €) Note 31 December 2010 31 December 2009
ASSETS
Non-current assets
Intangible assets (9) 317,168 312,952
Property, plant and equipment (10) 31,385,527 31,444,524
Investments (11) 11,423,278,781 13,990,570,445
Other financial assets (12) 143,946,821 26,887,235
Other non-current assets (13) 147,228 203,339
Deferred tax assets (8) - -
Total non-current assets 11,599,075,525 14,049,418,495
CURRENT ASSETS
Inventory (26) - -
Trade receivables (14) 8,078,126 60,015,344
Current financial receivables (15) 311,525,962 646,074,366
Other current receivables (16) 350,553,632 198,923,165
Cash and cash equivalents (17) 239,970 473,678
Total current assets 670,397,690 905,486,553
Assets to be demerged (18) 5,190,346,053 -
TOTAL ASSETS 17,459,819,268 14,954,905,048
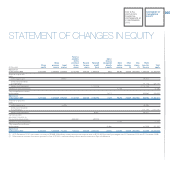
EQUITY AND LIABILITIES
Equity (19)
Share capital 6,377,262,975 6,377,262,975
Share premium reserve 1,540,884,892 1,540,884,892
Legal reserve 716,458,326 699,460,149
Other reserves and retained profit 4,284,447,608 4,185,828,196
Own shares (656,553,154) (656,553,154)
Profit/(loss) for the period 441,959,509 339,963,538
Total equity 12,704,460,156 12,486,846,596
NON-CURRENT LIABILITIES
Provisions for employee benefits and other non-current provisions (20) 20,072,106 25,441,360
Non-current financial liabilities (21) 2,561,442,000 1,816,781,700
Other non-current liabilities (22) 13,560,651 14,351,219
Deferred tax liabilities (8) 7,000,000 -
Total non-current liabilities 2,602,074,757 1,856,574,279
Current liabilities
Provisions for employee benefits and other current provisions (23) 9,273,701 8,464,485
Trade payables (24) 41,011,205 156,249,422
Current financial liabilities (25) 294,591,561 156,711,975
Other payables (26) 368,407,888 290,058,291
Total current liabilities 713,284,355 611,484,173
Liabilities to be demerged (18) 1,440,000,000 -
TOTAL EQUITY AND LIABILITIES 17,459,819,268 14,954,905,048
(*) Pursuant to Consob Resolution 15519 of 27 Ju ly 2006, the effects of transactions with related parties on the Statement of Financial Position of Fiat S.p.A. are presented in a specific statement of
financial position provided on the following pages and commented on in the notes to individual line items and Note 30.
STATEMENT OF FINANCIAL POSITION(*)
FIAT S.P.A.
STATUTORY
FINANCIAL
STATEMENTS AT
31 DECEMBER
2010
STATEMENT OF
FINANCIAL
POSITION