Chrysler 2010 Annual Report Download - page 74
Download and view the complete annual report
Please find page 74 of the 2010 Chrysler annual report below. You can navigate through the pages in the report by either clicking on the pages listed below, or by using the keyword search tool below to find specific information within the annual report.-
 1
1 -
2
-
3
-
4
-
5
-
6
-
7
-
8
-
9
-
10
-
11
-
12
-
13
-
14
-
15
-
16
-
17
-
18
-
19
-
20
-
21
-
22
-
23
-
24
-
25
-
26
-
27
-
28
-
29
-
30
-
31
-
32
-
33
-
34
-
35
-
36
-
37
-
38
-
39
-
40
-
41
-
42
-
43
-
44
-
45
-
46
-
47
-
48
-
49
-
50
-
51
-
52
-
53
-
54
-
55
-
56
-
57
-
58
-
59
-
60
-
61
-
62
-
63
-
 64
64 -
 65
65 -
 66
66 -
 67
67 -
 68
68 -
 69
69 -
 70
70 -
 71
71 -
 72
72 -
 73
73 -
 74
74 -
 75
75 -
 76
76 -
 77
77 -
 78
78 -
 79
79 -
 80
80 -
 81
81 -
 82
82 -
 83
83 -
 84
84 -
85
-
86
-
87
-
88
-
89
-
90
-
91
-
92
-
93
-
94
-
95
-
96
-
97
-
98
-
99
-
100
-
101
-
102
-
103
-
104
-
105
-
106
-
107
-
108
-
109
-
110
-
111
-
112
-
113
-
114
-
115
-
116
-
117
-
118
-
119
-
120
-
121
-
122
-
123
-
124
-
125
-
126
-
127
-
128
-
129
-
130
-
131
-
132
-
133
-
134
-
135
-
136
-
137
-
138
-
139
-
140
-
141
-
142
-
143
-
144
-
145
-
146
-
147
-
148
-
149
-
150
-
151
-
152
-
153
-
154
-
155
-
156
-
157
-
158
-
159
-
160
-
161
-
162
-
163
-
164
-
165
-
166
-
167
-
168
-
169
-
170
-
171
-
172
-
173
-
174
-
175
-
176
-
177
-
178
-
179
-
180
-
181
-
182
-
183
-
184
-
185
-
186
-
187
-
188
-
189
-
190
-
191
-
192
-
193
-
194
-
195
-
196
-
197
-
198
-
199
-
200
-
201
-
202
-
203
-
204
-
205
-
206
-
207
-
208
-
209
-
210
-
211
-
212
-
213
-
214
-
215
-
216
-
217
-
218
-
219
-
220
-
221
-
222
-
223
-
224
-
225
-
226
-
227
-
228
-
229
-
230
-
231
-
232
-
233
-
234
-
235
-
236
-
237
-
238
-
239
-
240
-
241
-
242
-
243
-
244
-
245
-
246
-
247
-
248
-
249
-
250
-
251
-
252
-
253
-
254
-
255
-
256
-
257
-
258
-
259
-
260
-
261
-
262
-
263
-
264
-
265
-
266
-
267
-
268
-
269
-
270
-
271
-
272
-
273
-
274
-
275
-
276
-
277
-
278
-
279
-
280
-
281
-
282
-
283
-
284
-
285
-
286
-
287
-
288
-
289
-
290
-
291
-
292
-
293
-
294
-
295
-
296
-
297
-
298
-
299
-
300
-
301
-
302
-
303
-
304
-
305
-
306
-
307
-
308
-
309
-
310
-
311
-
312
-
313
-
314
-
315
-
316
-
317
-
318
-
319
-
320
-
321
-
322
-
323
-
324
-
325
-
326
-
327
-
328
-
329
-
330
-
331
-
332
-
333
-
334
-
335
-
336
-
337
-
338
-
339
-
340
-
341
-
342
-
343
-
344
-
345
-
346
-
347
-
348
-
349
-
350
-
351
-
352
-
353
-
354
-
355
-
356
-
357
-
358
-
359
-
360
-
361
-
362
-
363
-
364
-
365
-
366
-
367
-
368
-
369
-
370
-
371
-
372
-
373
-
374
-
375
-
376
-
377
-
378
-
379
-
380
-
381
-
382
-
383
-
384
-
385
-
386
-
387
-
388
-
389
-
390
-
391
-
392
-
393
-
394
-
395
-
396
-
397
-
398
-
399
-
400
-
401
-
402
 |
 |

73
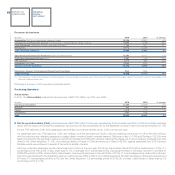
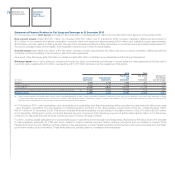
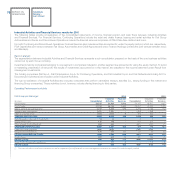
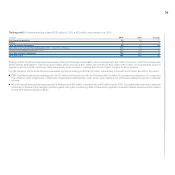
Statement of Cash Flows
Following is a summary statement of cash flows which includes both Continuing and Discontinued Operations. A full statement of cash flows is provided
in the section Consolidated Financial Statements. The comments primarily relate to cash from Continuing Operations, but certain pertinent information
regarding cash from Discontinued Operations has also been provided.
(€ million)
2010 2009 (*)
A) CASH AND CASH EQUIVALENTS AT BEGINNING OF THE YEAR (AS REPORTED) 12,226 3,683
Cash and cash equivalents included under Assets held for sale - -
B) CASH AND CASH EQUIVALENTS AT BEGINNING OF THE YEAR 12,226 3,683
C) CASH FROM/(USED IN) OPERATING ACTIVITIES 6,110 4.601
D) CASH FROM/(USED IN) INVESTING ACTIVITIES (3,953) (2,559)
E) CASH FROM/(USED IN) FINANCING ACTIVITIES 911 6,281
Currency translation differences 359 220
F) NET CHANGE IN CASH AND CASH EQUIVALENTS 3,427 8,543
G) CASH AND CASH EQUIVALENTS AT END OF THE YEAR 15,653 12,226
of which: Cash and cash equivalents included under Assets held for sale - -
H) CASH AND CASH EQUIVALENTS AT END OF THE YEAR (AS REPORTED) 15,653 12,226
(*) 2009 figures have been reclassified, as required by IFRS 5
For 2010, cash generated by operating activities was €6.1 billion, of which €2.5 billion related to Discontinued Operations.
Of the approximately €3.6 billion in cash generated by Continuing Operations during the year, €2.6 billion was from income-related inflows (calculated
as net profit plus amortization and depreciation, dividends, changes in provisions and various items related to sales with buy-back commitments and
operating leases, net of gains/losses on disposals and other non-cash items) with approximately €1 billion resulting from a decrease in working capital
(calculated on a comparable scope of operations and at constant exchange rates).
For Discontinued Operations, in addition to the approximate €1.5 billion in income-related inflows, approximately €1 billion was generated from a decrease
in working capital.
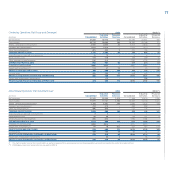
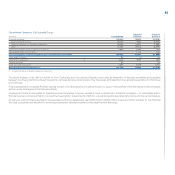
Cash used in investing activities totaled nearly €4 billion. In addition to the approximately €0.5 billion used in investing activities relating to Discontinued
Operations, cash used in investing activities for Continuing Operations totaled €3.5 billion and consisted of:
Expenditure on tangible and intangible assets (including €886 million in capitalized development costs) totaled €2,864 million.
Investments in subsidiaries and associates, totaling €283 million, mainly related to capitalization of the 50/50 joint venture GAC Fiat Automobiles
Co. Ltd. (China), and the 50/50 joint venture Fiat India Automobiles Private Limited (India); the acquisition of 50% of Fiat-GM Powertrain Polska and
100% of TCA - Tecnologia em Componentes Automotivos SA (Pernambuco state, Brazil); and the exercise of a call option held by Fiat on 5% of the
share capital of Ferrari, in relation to which a financial payable of an equivalent amount was recognized.
Proceeds from the sale of non-current assets totaled €57 million and related to tangible and intangible assets.
The €594 million increase in receivables from financing activities related to FGA’s financial services companies outside Europe.
Cash used in investing activities for Discontinued Operations totaled approximately €0.5 billion and primarily related to the approximately €0.9 billion in
investments (including equity investments), less approximately €0.4 billion in cash generated through the decrease in receivables from financing activities.
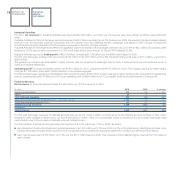
Cash from financing activities totaled approximately €0.9 billion. Continuing Operations used approximately €1.2 billion in cash: €1 billion for redemption
of a bond at maturity and dividend payments of €239 million were only partly offset by cash from new borrowings.
Discontinued Operations, on the other hand, generated approximately €2.1 billion. Cash inflows related to a USD 1.5 billion bond issued by Case New Holland
Inc., an increase in asset-backed financing and a net increase in other financing, which were only partially offset by early repayment of a USD 500 million bond,
by CNH, that was originally scheduled for repayment on 1 March 2014.