Chrysler 2010 Annual Report Download - page 179
Download and view the complete annual report
Please find page 179 of the 2010 Chrysler annual report below. You can navigate through the pages in the report by either clicking on the pages listed below, or by using the keyword search tool below to find specific information within the annual report.-
 1
1 -
2
-
3
-
4
-
5
-
6
-
7
-
8
-
9
-
10
-
11
-
12
-
13
-
14
-
15
-
16
-
17
-
18
-
19
-
20
-
21
-
22
-
23
-
24
-
25
-
26
-
27
-
28
-
29
-
30
-
31
-
32
-
33
-
34
-
35
-
36
-
37
-
38
-
39
-
40
-
41
-
42
-
43
-
44
-
45
-
46
-
47
-
48
-
49
-
50
-
51
-
52
-
53
-
54
-
55
-
56
-
57
-
58
-
59
-
60
-
61
-
62
-
63
-
64
-
65
-
66
-
67
-
68
-
69
-
70
-
71
-
72
-
73
-
74
-
75
-
76
-
77
-
78
-
79
-
80
-
81
-
82
-
83
-
84
-
85
-
86
-
87
-
88
-
89
-
90
-
91
-
92
-
93
-
94
-
95
-
96
-
97
-
98
-
99
-
100
-
101
-
102
-
103
-
104
-
105
-
106
-
107
-
108
-
109
-
110
-
111
-
112
-
113
-
114
-
115
-
116
-
117
-
118
-
119
-
120
-
121
-
122
-
123
-
124
-
125
-
126
-
127
-
128
-
129
-
130
-
131
-
132
-
133
-
134
-
135
-
136
-
137
-
138
-
139
-
140
-
141
-
142
-
143
-
144
-
145
-
146
-
147
-
148
-
149
-
150
-
151
-
152
-
153
-
154
-
155
-
156
-
157
-
158
-
159
-
160
-
161
-
162
-
163
-
164
-
165
-
166
-
167
-
168
-
 169
169 -
 170
170 -
 171
171 -
 172
172 -
 173
173 -
 174
174 -
 175
175 -
 176
176 -
 177
177 -
 178
178 -
 179
179 -
 180
180 -
 181
181 -
 182
182 -
 183
183 -
 184
184 -
 185
185 -
 186
186 -
 187
187 -
 188
188 -
 189
189 -
190
-
191
-
192
-
193
-
194
-
195
-
196
-
197
-
198
-
199
-
200
-
201
-
202
-
203
-
204
-
205
-
206
-
207
-
208
-
209
-
210
-
211
-
212
-
213
-
214
-
215
-
216
-
217
-
218
-
219
-
220
-
221
-
222
-
223
-
224
-
225
-
226
-
227
-
228
-
229
-
230
-
231
-
232
-
233
-
234
-
235
-
236
-
237
-
238
-
239
-
240
-
241
-
242
-
243
-
244
-
245
-
246
-
247
-
248
-
249
-
250
-
251
-
252
-
253
-
254
-
255
-
256
-
257
-
258
-
259
-
260
-
261
-
262
-
263
-
264
-
265
-
266
-
267
-
268
-
269
-
270
-
271
-
272
-
273
-
274
-
275
-
276
-
277
-
278
-
279
-
280
-
281
-
282
-
283
-
284
-
285
-
286
-
287
-
288
-
289
-
290
-
291
-
292
-
293
-
294
-
295
-
296
-
297
-
298
-
299
-
300
-
301
-
302
-
303
-
304
-
305
-
306
-
307
-
308
-
309
-
310
-
311
-
312
-
313
-
314
-
315
-
316
-
317
-
318
-
319
-
320
-
321
-
322
-
323
-
324
-
325
-
326
-
327
-
328
-
329
-
330
-
331
-
332
-
333
-
334
-
335
-
336
-
337
-
338
-
339
-
340
-
341
-
342
-
343
-
344
-
345
-
346
-
347
-
348
-
349
-
350
-
351
-
352
-
353
-
354
-
355
-
356
-
357
-
358
-
359
-
360
-
361
-
362
-
363
-
364
-
365
-
366
-
367
-
368
-
369
-
370
-
371
-
372
-
373
-
374
-
375
-
376
-
377
-
378
-
379
-
380
-
381
-
382
-
383
-
384
-
385
-
386
-
387
-
388
-
389
-
390
-
391
-
392
-
393
-
394
-
395
-
396
-
397
-
398
-
399
-
400
-
401
-
402
 |
 |

FIAT GROUP
CONSOLIDATED
FINANCIAL
STATEMENTS
AT 31 DECEMBER
2010
NOTES
178
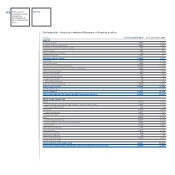
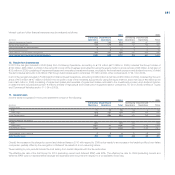
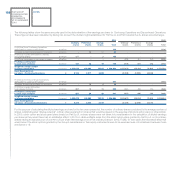
COMPOSITION AND PRINCIPAL CHANGES
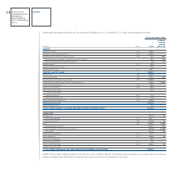
1. Net revenues
Net revenues may be analysed as follows:
2010 2009
Continuing Discontinued Continuing Discontinued
(€ million)
Operations Operations Eliminations Total Operations Operations Eliminations Total
Sales of goods 32,752 19,728 (725) 51,755 29,981 16,288 (311) 45,958
Rendering of services 2,163 486 (244) 2,405 2,223 502 (229) 2,496
Interest income from customers and other financial income
of financial services companies 186 781 (17) 950 119 814 (15) 918
Contract revenues 708 3 22 7332 53 - 5 258
Rents on assets sold with a buy-back commitment 45 181 - 226 72 199 - 271
Rents on operating leases 1 149 - 150 19 148 - 167
Other 25 14 - 39 17 17 - 34
Total Net revenues 35,880 21,342 (964) 56,258 32,684 17,968 (550) 50,102
2. Cost of sales
Cost of sales comprises the following:
2010 2009
Continuing Discontinued Continuing Discontinued
(€ million)
Operations Operations Eliminations Total Operations Operations Eliminations Total
Interest cost and other financial expenses
from financial services companies 107 761 (5) 863 63 749 (8) 804
Other costs of sales 30,611 17,218 (954) 46,875 28,189 14,800 (532) 42,457
Total Cost of sales 30,718 17,979 (959) 47,738 28,252 15,549 (540) 43,261
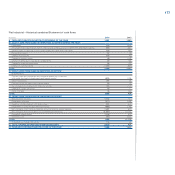
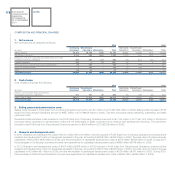
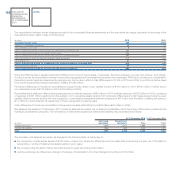
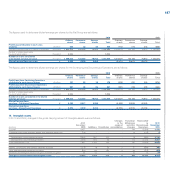
3. Selling, general and administrative costs
Selling costs included in Profit (loss) from Continuing Operations amount to €1,812 million in 2010 (€1,666 million in 2009). Selling costs included in Profit
(loss) from Discontinued Operations amount to €897 million in 2010 (€838 million in 2009). This item comprises mainly marketing, advertising, and sales
personnel costs.
General and administrative costs included in the Profit (loss) from Continuing Operations amount to €1,144 million in 2010 (€1,007 million in 2009) and
comprise mainly expenses for administration which are not attributable to sales, production and research and development functions. The same item
included in the Profit (loss) from Discontinued Operations amount to €896 million in 2010 (€798 million in 2009).
4. Research and development costs
In 2010, Research and development costs of €1,013 million (€1,010 million in 2009) included in Profit (loss) from Continuing Operations comprise all the
research and development costs not recognised as assets in the year, amounting to €398 million (€406 million in 2009), the write-down of costs previously
capitalised of €39 million (€46 million in 2009), and the amortisation of capitalised development costs of €576 million (€558 million in 2009). During 2010,
the businesses in Continuing Operations incurred new expenditure for capitalised development costs of €886 million (€748 million in 2009).
In 2010, Research and development costs of €418 million (€388 million in 2009) included in Profit (loss) from Discontinued Operations comprise all the
research and development costs not recognised as assets in the year, amounting to €256 million (€240 million in 2009), the write-down of costs previously
capitalised of €3 million (€1 million in 2009), and the amortisation of capitalised development costs of €159 million (€147 million in 2009). During 2010,
the businesses in Discontinued Operations incurred new expenditure for capitalised development costs of €396 million (€298 million in 2009).