Chrysler 2010 Annual Report Download - page 125
Download and view the complete annual report
Please find page 125 of the 2010 Chrysler annual report below. You can navigate through the pages in the report by either clicking on the pages listed below, or by using the keyword search tool below to find specific information within the annual report.-
 1
1 -
2
-
3
-
4
-
5
-
6
-
7
-
8
-
9
-
10
-
11
-
12
-
13
-
14
-
15
-
16
-
17
-
18
-
19
-
20
-
21
-
22
-
23
-
24
-
25
-
26
-
27
-
28
-
29
-
30
-
31
-
32
-
33
-
34
-
35
-
36
-
37
-
38
-
39
-
40
-
41
-
42
-
43
-
44
-
45
-
46
-
47
-
48
-
49
-
50
-
51
-
52
-
53
-
54
-
55
-
56
-
57
-
58
-
59
-
60
-
61
-
62
-
63
-
64
-
65
-
66
-
67
-
68
-
69
-
70
-
71
-
72
-
73
-
74
-
75
-
76
-
77
-
78
-
79
-
80
-
81
-
82
-
83
-
84
-
85
-
86
-
87
-
88
-
89
-
90
-
91
-
92
-
93
-
94
-
95
-
96
-
97
-
98
-
99
-
100
-
101
-
102
-
103
-
104
-
105
-
106
-
107
-
108
-
109
-
110
-
111
-
112
-
113
-
114
-
 115
115 -
 116
116 -
 117
117 -
 118
118 -
 119
119 -
 120
120 -
 121
121 -
 122
122 -
 123
123 -
 124
124 -
 125
125 -
 126
126 -
 127
127 -
 128
128 -
 129
129 -
 130
130 -
 131
131 -
 132
132 -
 133
133 -
 134
134 -
 135
135 -
136
-
137
-
138
-
139
-
140
-
141
-
142
-
143
-
144
-
145
-
146
-
147
-
148
-
149
-
150
-
151
-
152
-
153
-
154
-
155
-
156
-
157
-
158
-
159
-
160
-
161
-
162
-
163
-
164
-
165
-
166
-
167
-
168
-
169
-
170
-
171
-
172
-
173
-
174
-
175
-
176
-
177
-
178
-
179
-
180
-
181
-
182
-
183
-
184
-
185
-
186
-
187
-
188
-
189
-
190
-
191
-
192
-
193
-
194
-
195
-
196
-
197
-
198
-
199
-
200
-
201
-
202
-
203
-
204
-
205
-
206
-
207
-
208
-
209
-
210
-
211
-
212
-
213
-
214
-
215
-
216
-
217
-
218
-
219
-
220
-
221
-
222
-
223
-
224
-
225
-
226
-
227
-
228
-
229
-
230
-
231
-
232
-
233
-
234
-
235
-
236
-
237
-
238
-
239
-
240
-
241
-
242
-
243
-
244
-
245
-
246
-
247
-
248
-
249
-
250
-
251
-
252
-
253
-
254
-
255
-
256
-
257
-
258
-
259
-
260
-
261
-
262
-
263
-
264
-
265
-
266
-
267
-
268
-
269
-
270
-
271
-
272
-
273
-
274
-
275
-
276
-
277
-
278
-
279
-
280
-
281
-
282
-
283
-
284
-
285
-
286
-
287
-
288
-
289
-
290
-
291
-
292
-
293
-
294
-
295
-
296
-
297
-
298
-
299
-
300
-
301
-
302
-
303
-
304
-
305
-
306
-
307
-
308
-
309
-
310
-
311
-
312
-
313
-
314
-
315
-
316
-
317
-
318
-
319
-
320
-
321
-
322
-
323
-
324
-
325
-
326
-
327
-
328
-
329
-
330
-
331
-
332
-
333
-
334
-
335
-
336
-
337
-
338
-
339
-
340
-
341
-
342
-
343
-
344
-
345
-
346
-
347
-
348
-
349
-
350
-
351
-
352
-
353
-
354
-
355
-
356
-
357
-
358
-
359
-
360
-
361
-
362
-
363
-
364
-
365
-
366
-
367
-
368
-
369
-
370
-
371
-
372
-
373
-
374
-
375
-
376
-
377
-
378
-
379
-
380
-
381
-
382
-
383
-
384
-
385
-
386
-
387
-
388
-
389
-
390
-
391
-
392
-
393
-
394
-
395
-
396
-
397
-
398
-
399
-
400
-
401
-
402
 |
 |
REPORT ON
OPERATIONS
124
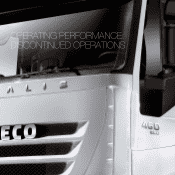
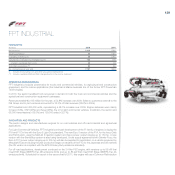
OPERATING
PERFORMANCE:
DISCONTINUED
OPERATIONS
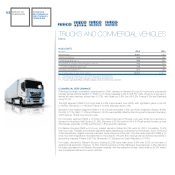
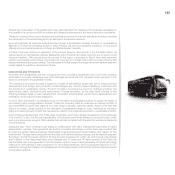
Iveco delivered a total of 6,780 buses during the year, down 12.8% over 2009.
In China, Naveco – the 50/50 joint venture with Nanjing Automotive Corporation (controlled by the SAIC Group)
– sold 32,081 light vehicles in the Power Daily range (up 28.1% over 2009) and 66,566 medium vehicles in the
Yuejin range (up 31.4% over 2009).
In 2010, SAIC Iveco Hongyan Commercial Vehicles Co. Ltd. (33.5% owned by Iveco), sold 30,509 heavy
commercial vehicles, representing a 55.7% increase over the previous year.
Including LSVs (for agricultural use), the two joint ventures sold a total of 140,608 units, up from 106,695 in
2009 (+31.8%).
Commercial Vehicle Sales – by country
(units in thousands) 2010 2009 % change
France 18.3 15.0 22.3
Germany 14.7 11.1 31.9
UK 5.1 3.7 36.9
Italy 21.7 21.7 -0.1
Spain 7.4 5.3 40.8
Rest of Western Europe 11.1 10.0 11.9
Western Europe 78.3 66.8 17.3
Eastern Europe 11.5 8.1 41.6
Rest of the World 39.8 29.0 37.3
Total Sales 129.6 103.9 24.8
Naveco 98.6 75.7 30.3
SAIC Iveco Hongyan 30.5 19.6 55.7
Grand Total 258.7 199.2 29.9
Commercial Vehicle Sales – by product
(units in thousands) 2010 2009 % change
Heavy 28.2 22.1 27.6
Medium 18.1 12.0 51.3
Light 71.9 57.4 25.3
Buses 6.8 7.8 -12.8
Special vehicles (*) 4.6 4.6 -0.2
Total Sales 129.6 103.9 24.8
(*) Astra, defence, fire trucks